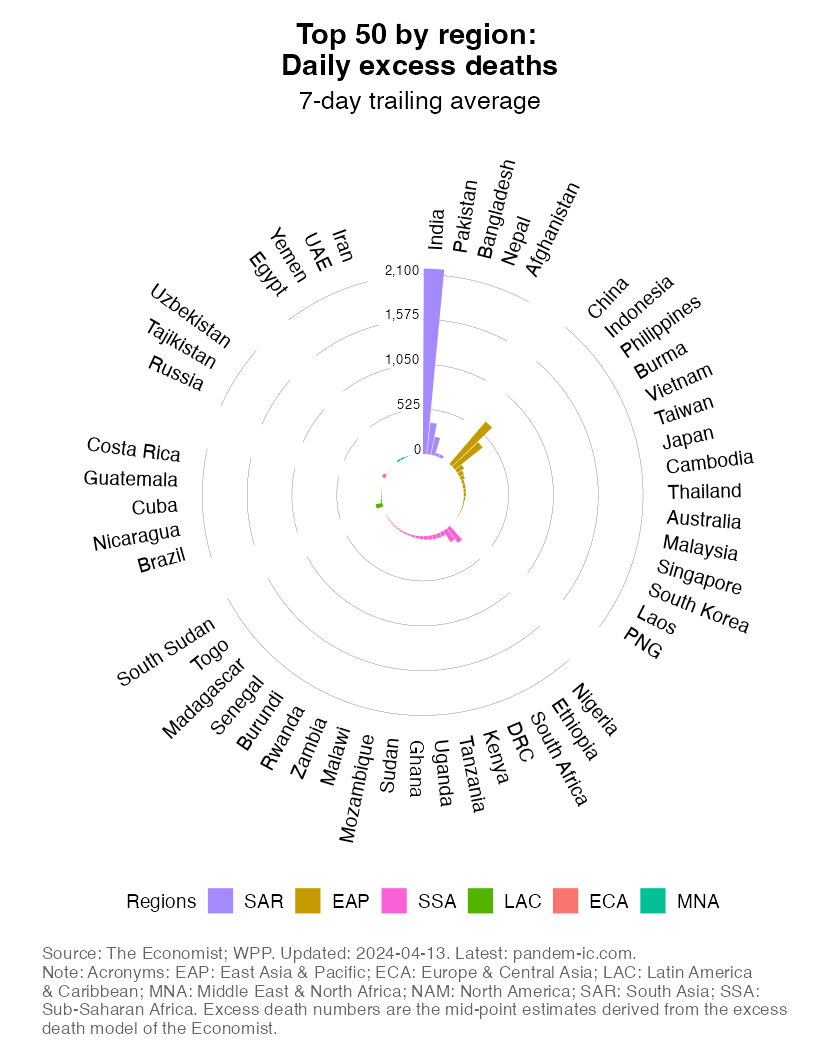
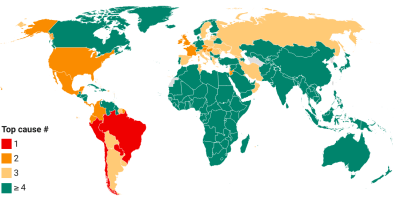
This chart takes a snapshot of the Top 50 countries which currently have the highest estimated daily excess mortality in absolute numbers. It groups the countries by World Bank region and ranks them within each region by the daily absolute excess mortality toll.
The excess death estimates are the mid-point estimates derived from excess death model of The Economist, which fills data gaps on the basis of a machine-learning algorithm that learns from official excess mortality date, where available, and over 100 other statistical indicators. The indicator is available on a weekly frequency and its values are converted into a smoothed average. For more details on methods and sources, check out the excess mortality entry in the list of background notes below.
The absolute expression of the excess mortality toll is useful to highlight the the contribution of countries or groups of countries to the global total. Excess mortality rates, which express the absolute toll relative to population size, provide an indication of performance controlling for population size. The absolute numbers however take the view that a life lost is a life lost, no matter where the person happened to live. It offers a valuable perspective on the absolute scale of the pandemic’s death toll.
Pandem-ic uses the World Bank income classification as a major building block in the analysis of the impact of the pandemic.
The income classification groups countries in four buckets by per capita income levels: high-income countries (HICs), upper-middle-income countries (UMICs), lower-middle-income countries (LMICs) and low-income countries (LICs). We use the current FY2022 classification, which determines the thresholds of the buckets as follows:
See here for a dynamic visualization of how the income classification of countries has changed over time through the current FY2022 classification
A good part of this site also analyzes the pandemic by region (where we use the World Bank regional classification and the UN geo-scheme of subregions). In both cases (i.e. across income groups and regions), the universe of countries is based on the World Bank income classification. More on that in the next note.
The universe of countries on this website is determined as follows.
Note that the vaccination data is pulled from Our World in Data, which utilizes a slightly different universe of locations. In sticking with the above 196 countries and economies, we have made the following adjustments relative to the OWID universe.
For each of the above adjustments to the vaccination data, we make adjustments to the demographic data that vaccine information is related to (including population size, age structure and priority group size).
Finally, note that no adjustments are required to the totals for France as its overseas territories and dependencies are already included.
Excess mortality can be defined as the gap between the total number of deaths that occur for any reason and the amount that would be expected under normal circumstances. Given the massive undercounting of the mortality toll both directly and indirectly attributed to COVID-19, excess mortality provides a useful way to get a glimpse of the true mortality toll.
Unfortunately, however, data on excess mortality are not universally available. Only 84 countries release some sort of data (national or subnational; regular or one-off) on excess deaths. This is where the excess deaths model of The Economist comes in as it tries to fill the gaps on the basis of a well-calibrated model that takes advantage of various types of data that CAN be observed.
At its core, the model relies on a machine-learning algorithm (a gradient booster) that learns from official excess-mortality data and over 100 other statistical indicators. Where data on excess deaths is available, they are used. Where such data are not available, the model fills the gaps in the form of single-point estimates.
Given the vast degree of uncertainty surrounding any point estimate, the model then uses a bootstrapping method to calculate standard errors. This amounts to using subsets of the full dataset (in terms of country-week pairs) and training different gradient-boosting models on each of these data subsets. The central estimate is derived then from the trained model on the full set of data, whereas the middle 95 of the predications generated by the 100 other models produce the 95% confidence intervals.
Further details on the methodology can be found here and the full model can be viewed here.