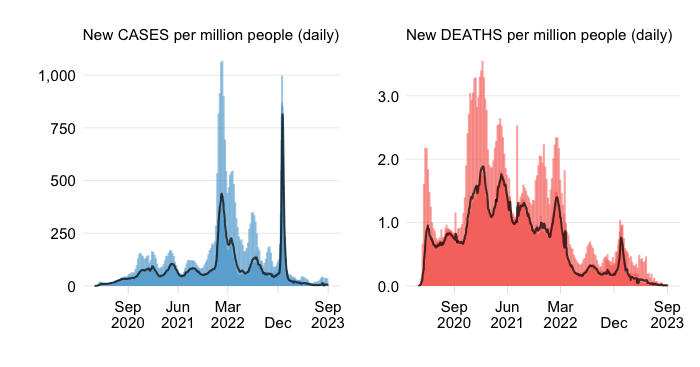
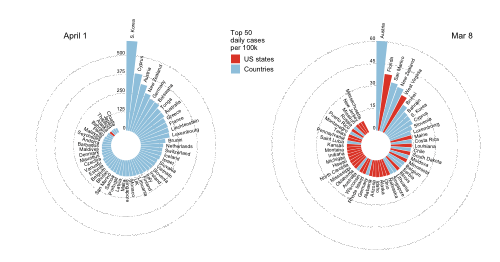
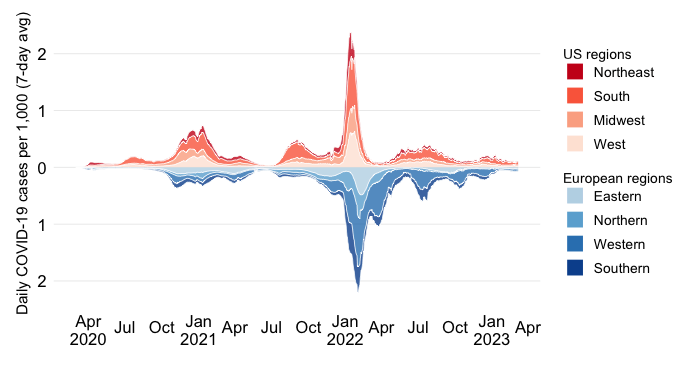
The Omicron surge as of mid-December 2021 caught the world by surprise. Combined with the effects of delta, the surge in Omicron cases represented a major escalation of the pandemic at a time when the Northern Hemisphere experienced cooler weather which raised the risk of exposure indoors. In what follows, we examine how severe the mortality impact has been. We calculate the absolute peaks in cases and fatalities before November 1, 2021 and after (up through through May 1, 2022) and compare them. We also look at the relative ratios between the two and differentiate these by World Bank income groups and regions.
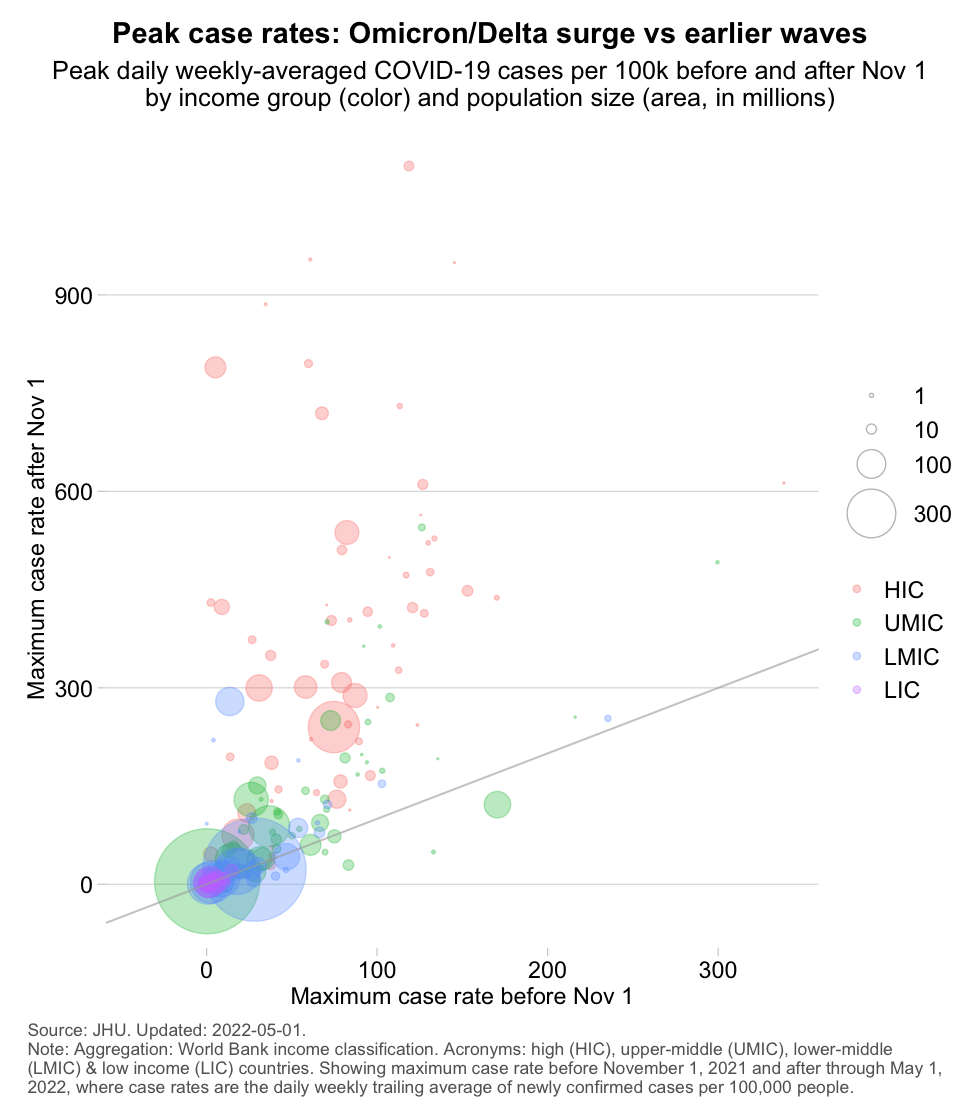
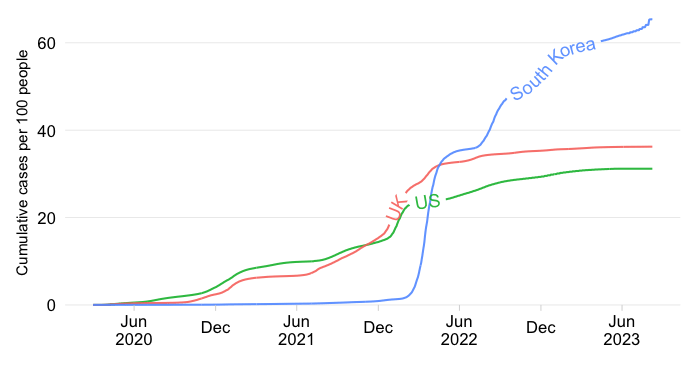
The chart shows a number of things. First, the peaks during earlier waves have generally been higher for high-income and upper-middle-income countries (HICs and UMICs). Second, the peaks during the current episode have been especially high for almost all HICs, as is demonstrated by their values being well above the 45-degree line. So, in absolute terms, we see the highest degree of escalation among countries that had high case rates to begin with!
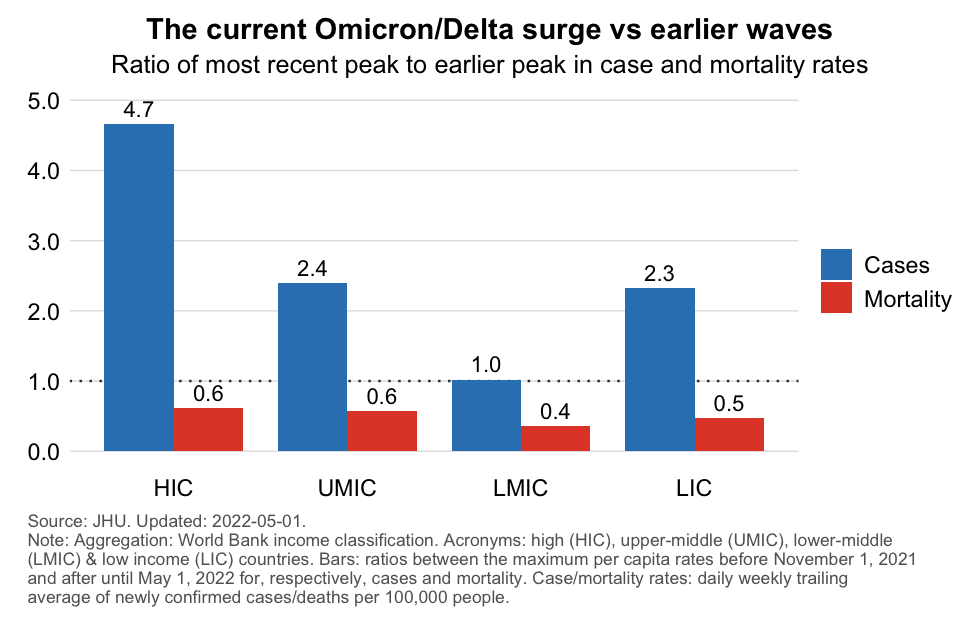
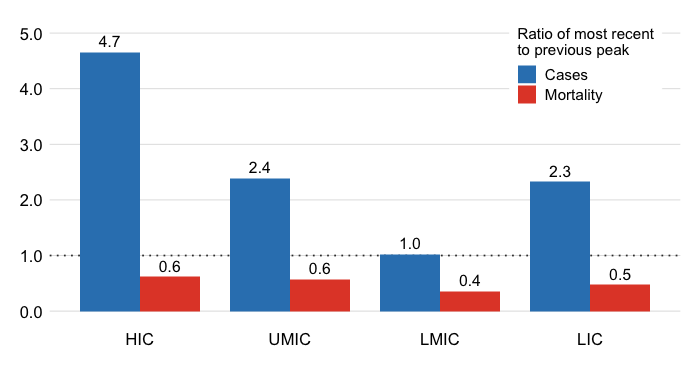
The chart clearly shows that on the cases side the escalation has been especially major in HICs and to a lesser extent in UMICs and LICs. For LMICs so far the peak has remained well below the previous peak (as indicated by a ratio below 1).
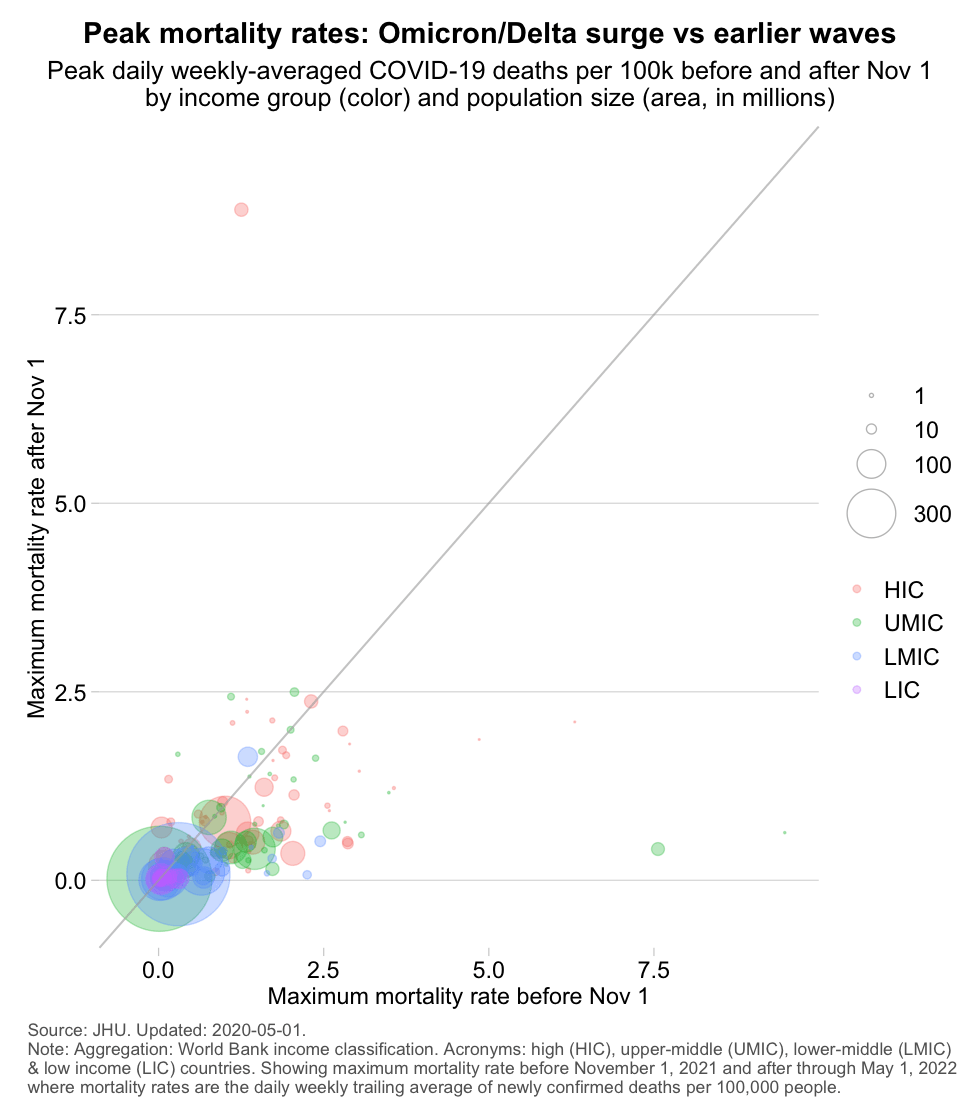
On the mortality side, we see that throughout the mortality peak has remained at a fraction of the earlier value. That fraction is not negligible, but compared to the scale of escalation in cases it does appear to be more muted. Note here also that the mortality impact reflects the combined effect of Omicron and Delta.
Interestingly, the degree of relative escalation is rather similar across country groups, which is a curious result to interpret as it will be the combined effect of differences in vaccination profiles, immunity from prior infection, seasonality and other environmental and host-specific factors.
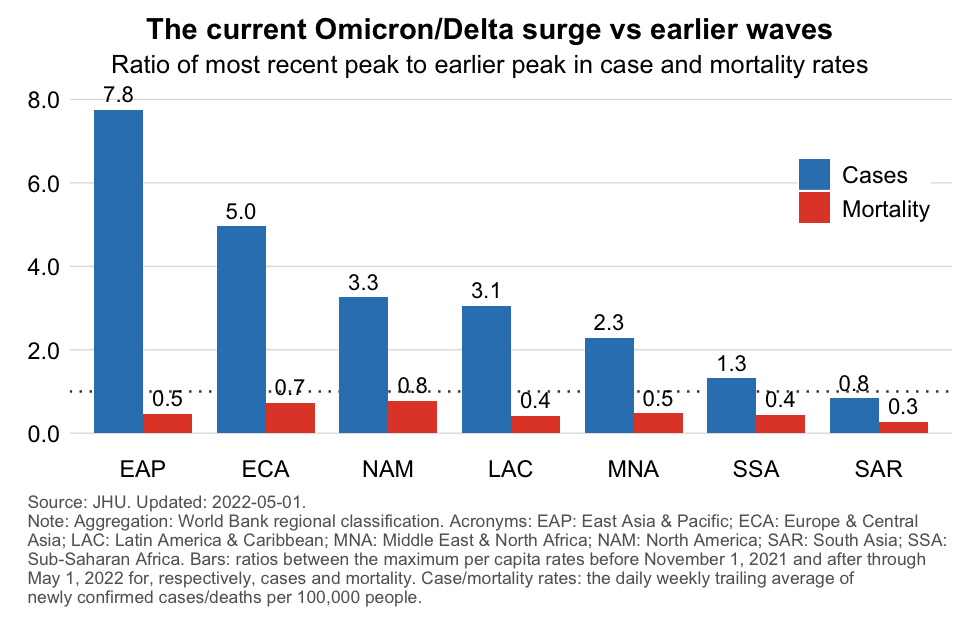
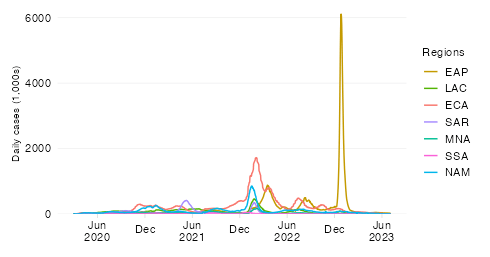
In the chart above, we replicate the same analysis at the level of World Bank regions (see footnote for acronyms). The most serious escalations have happened thus far in EAP, ECA, NAM and LAC. That’s for cases. The mortality escalation has thus far remained under 1, meaning lower impact than previous peaks (thus far). But we can already see that the relative mortality impact is very considerable for some regions.
The above charts capture the scale of the Omicron/ Delta escalation as it happened between November 2021 and May 2022. The general pattern is one of a dramatic escalation of cases, which centered on high-income and low-income countries. Luckily, while there are important exceptions at the country level, the mortality impact has remained muted across income groups and regions at a fraction of previous waves.
Disclaimer: Posts by the Center for Global Development reflect the views of the authors, drawing on prior research and experience in their areas of expertise. CGD is a nonpartisan, independent organization and does not take institutional positions. Likewise, views expressed do not necessarily reflect those of the United Nations, the United Nations Development Programme, its programmes/projects or governments. The designations employed do not imply the expression of any opinion whatsoever concerning the legal status of any country, territory or area, or its frontiers or boundaries.