To understand the true and total impact of the pandemic, we need to examine excess mortality. But how different are excess death estimates from officially reported covid mortality data? How has the gap between the two evolved at the country level? And what are the structural differences across World Bank income groups of countries?
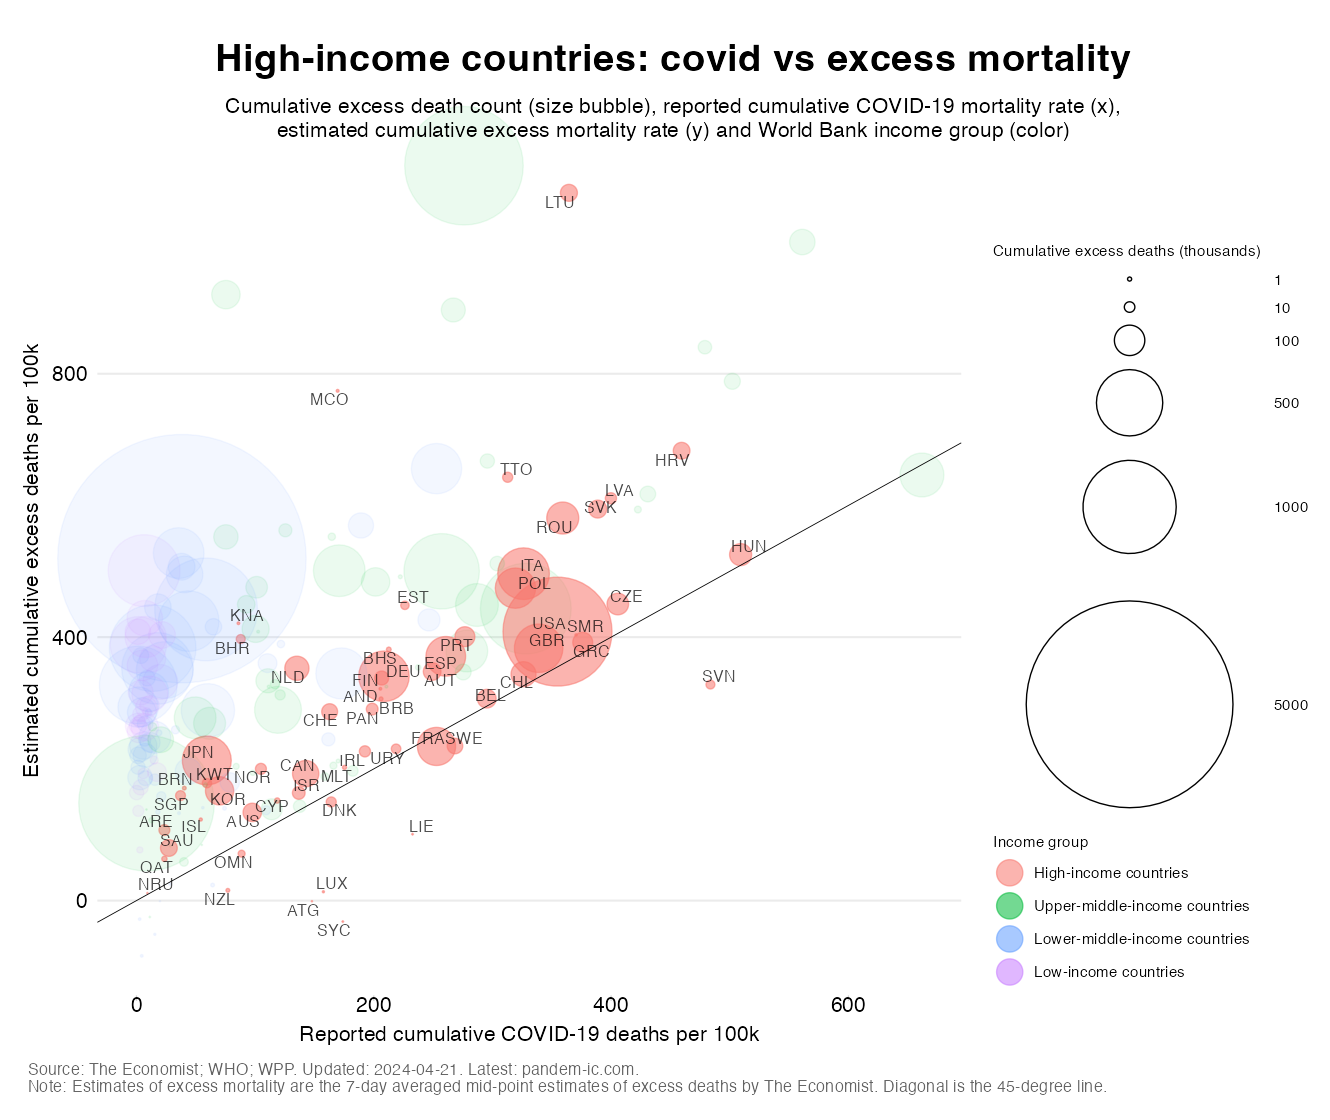
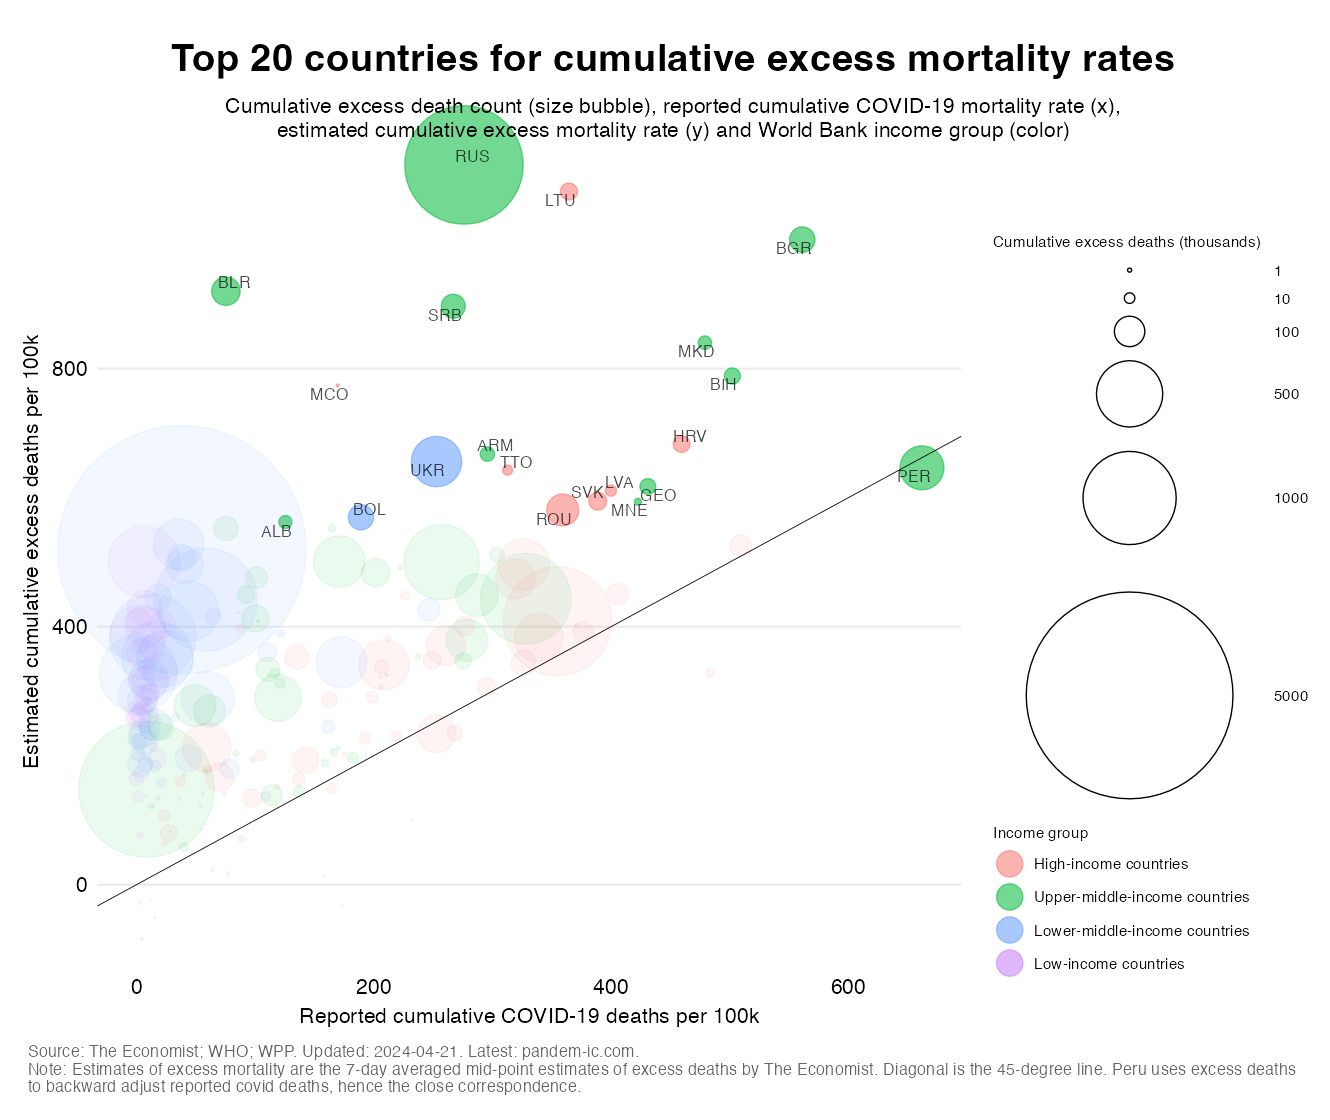
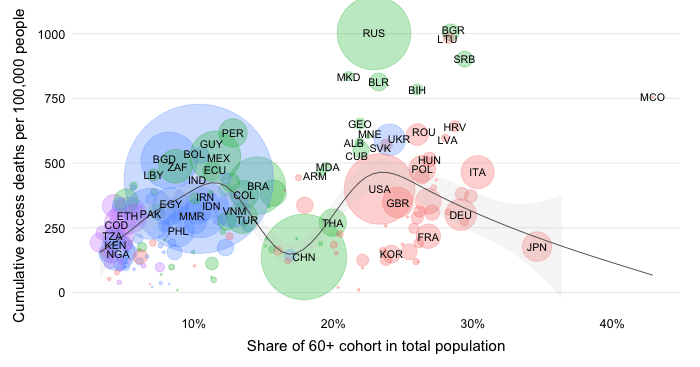
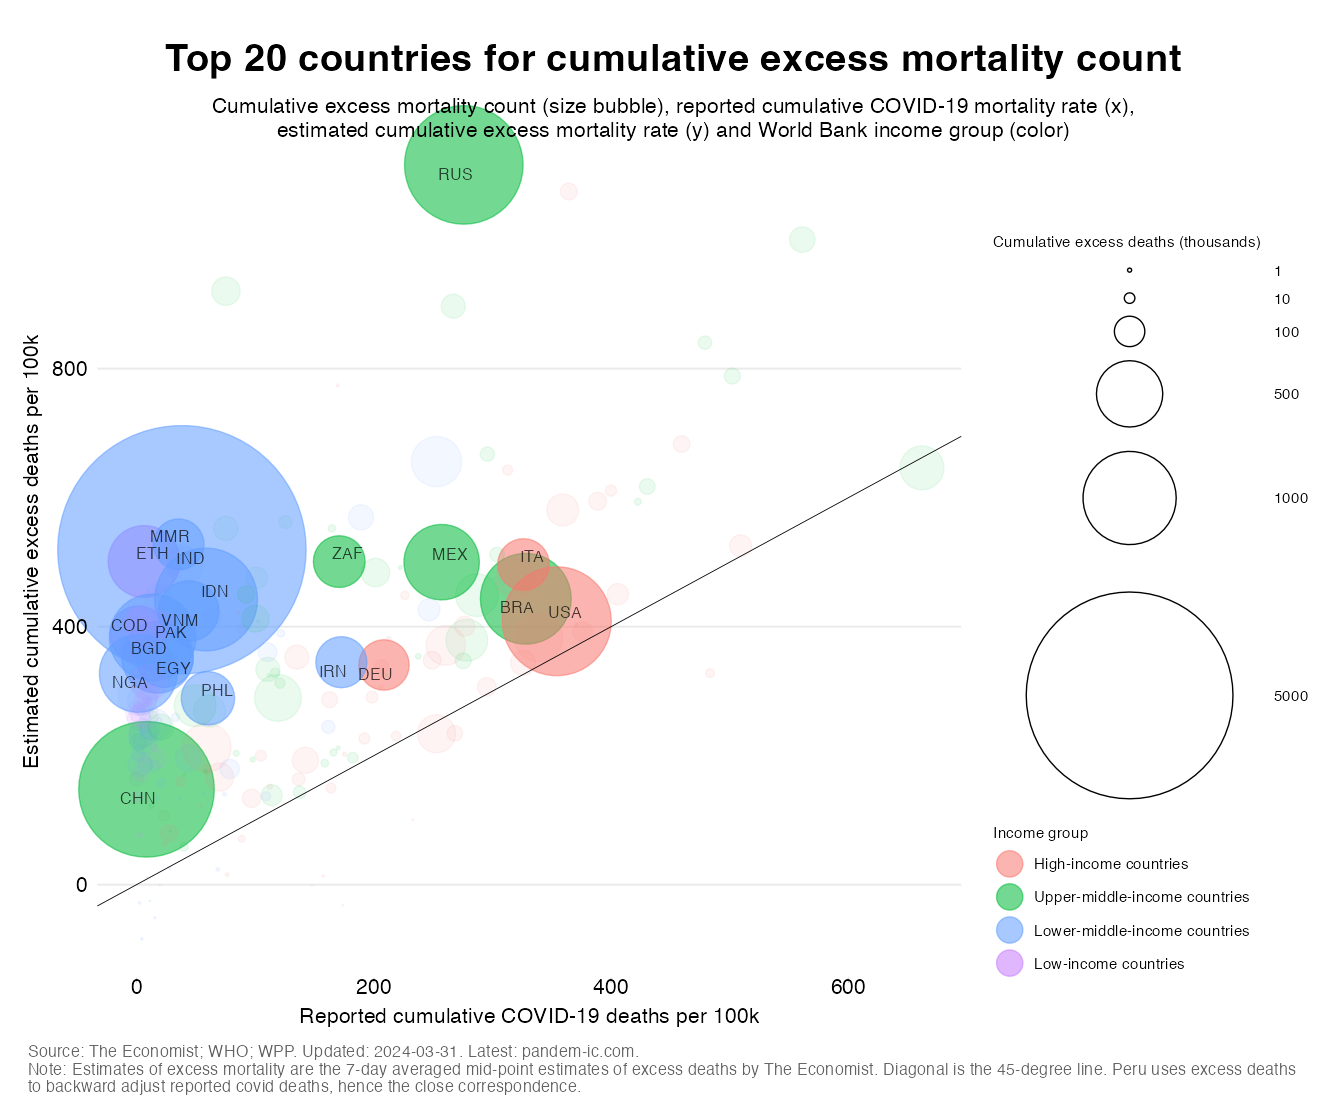
Let’s start with a dynamic visualization of the evolution of excess and covid mortality rates (accelerated version below and full version here). On the horizontal axis, we have the officially reported COVID-19 mortality rate (cumulative covid deaths per 100,000 people). On the vertical axis, we have the excess mortality estimate (cumulative excess deaths per 100,000 people), where we focus for now on the mid-point estimate of the excess death model by The Economist. The size of the bubbles correspond to the absolute size of the excess death toll (in thousands), whereas the color shows the World Bank income group the country belongs to.
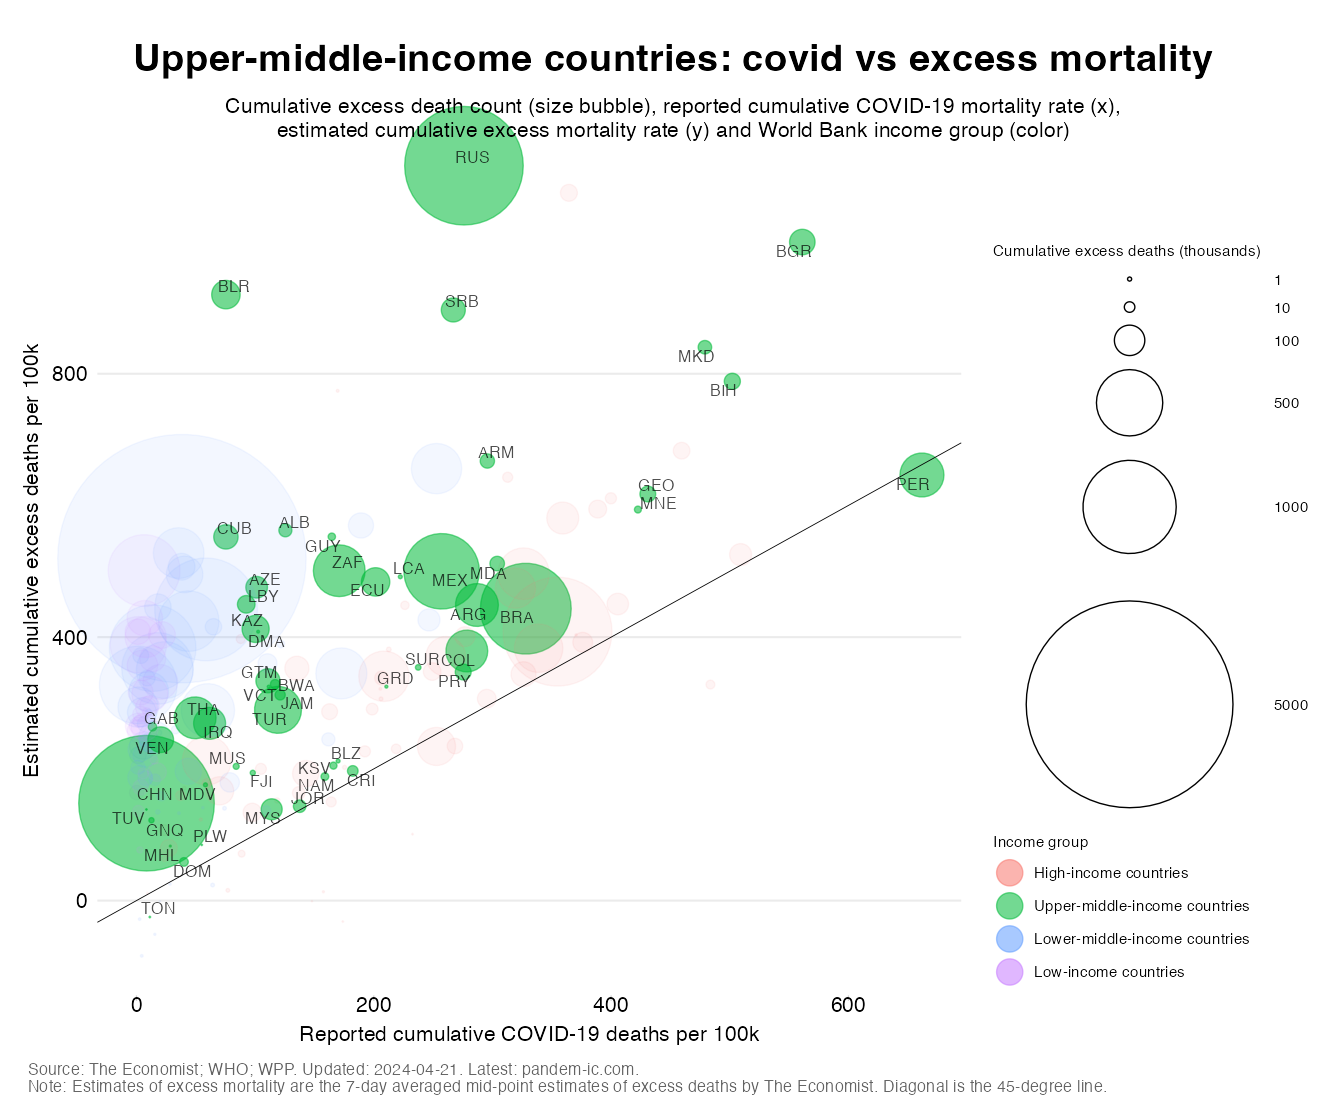
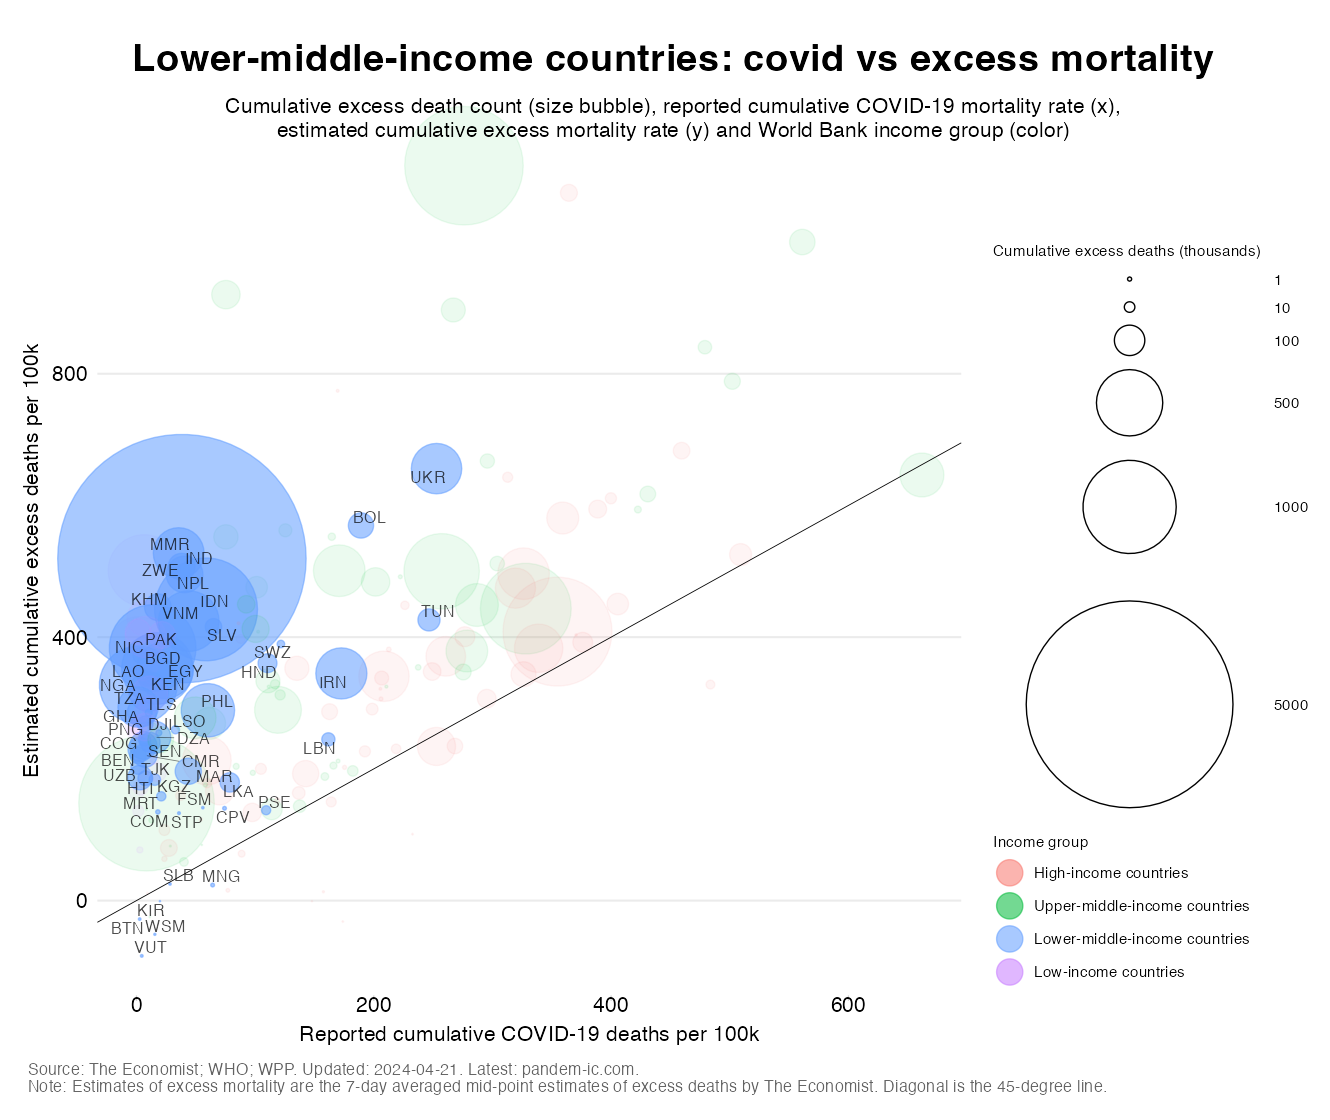
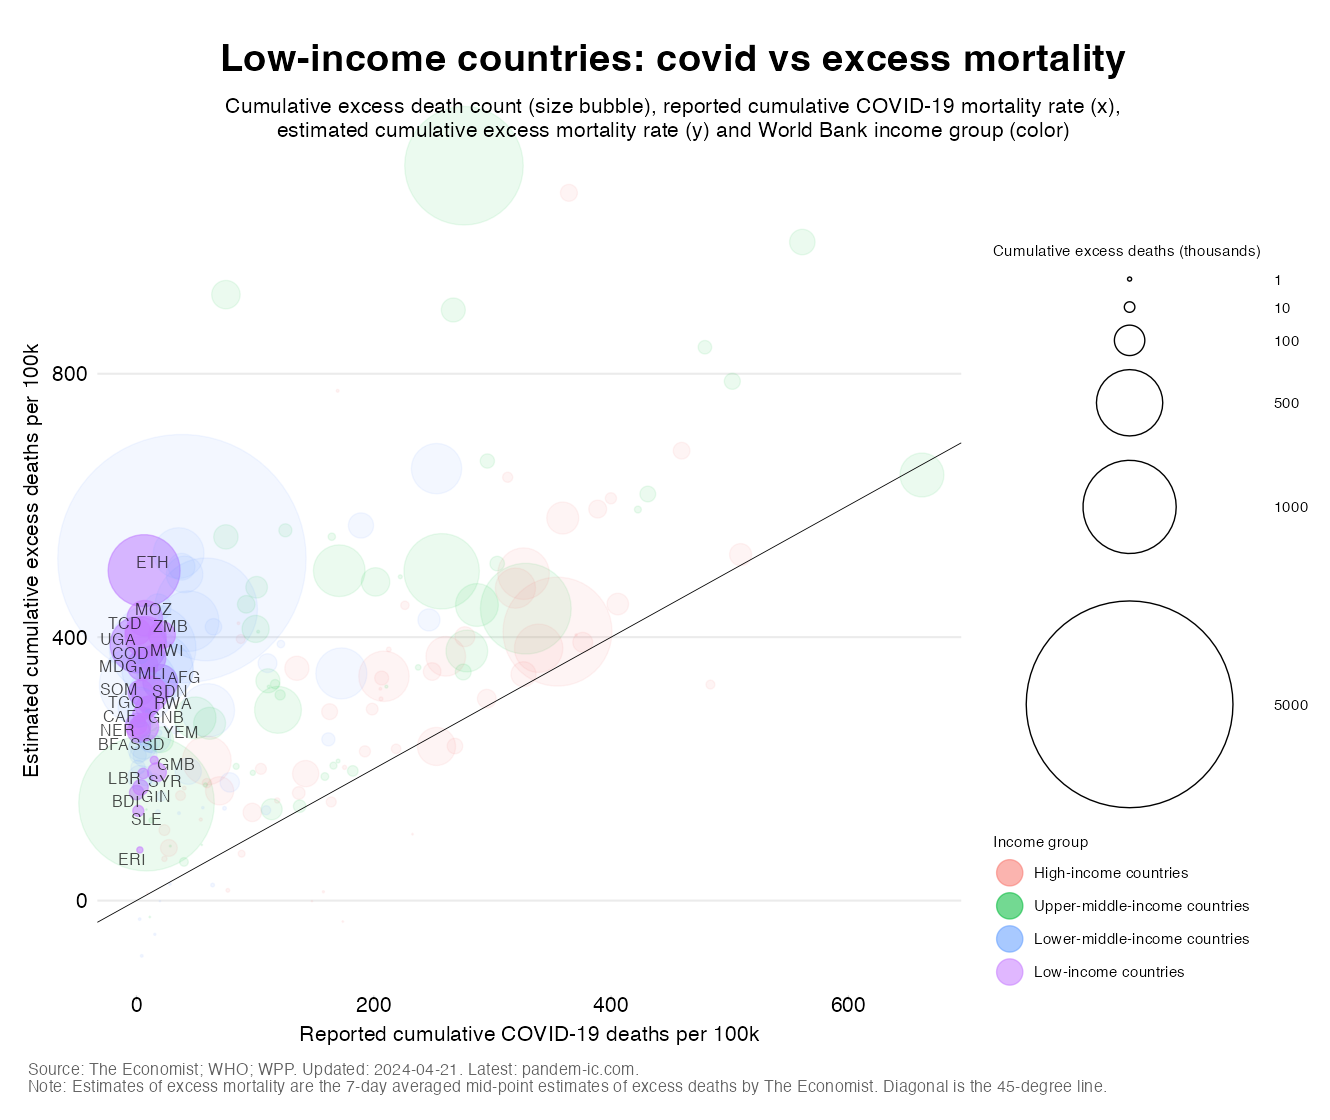
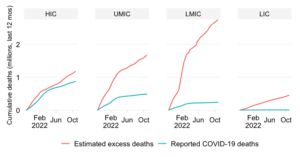
The dynamic visualization illustrates the quasi-universal pattern of excess mortality outpacing covid mortality. Over the course of the pandemic we have indeed seen a very considerable expansion of excess mortality over and beyond officially reported COVID-19 mortality. Developing countries appear to have been in the driving seat of this expansion. One outlier that clearly emerges from this chart is Peru, which progresses along the 45-degree line due to its policy of aligning excess and covid deaths. Elsewhere, we see considerable differences between the two mortality concept, but the extent of these differences varies a lot.
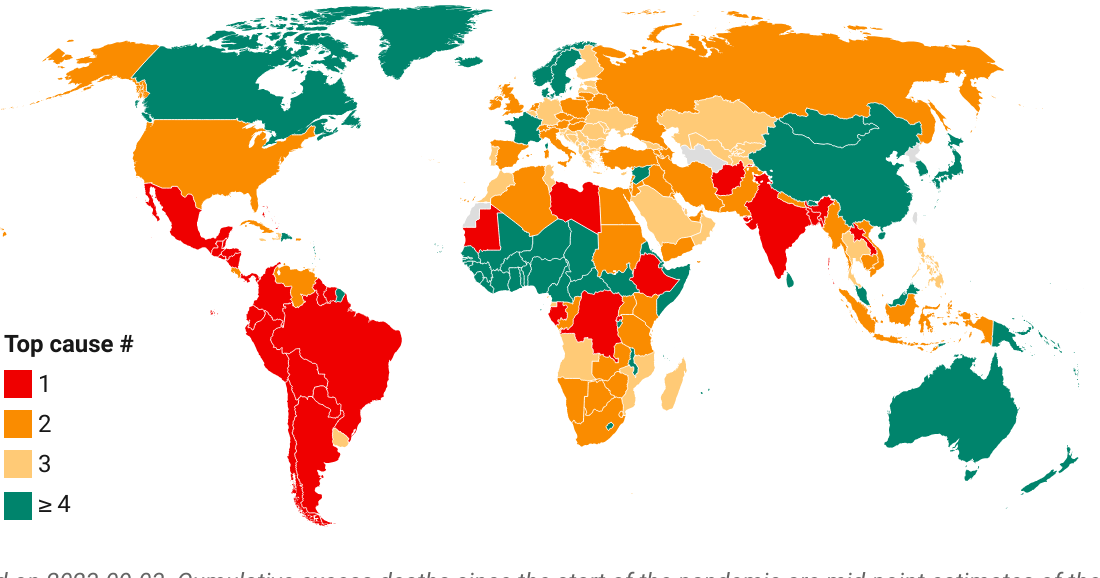
Let us now dissect this visualization by focusing on the most recent date and looking at the outcomes through the lens of the World Bank income classification (see gallery below). The following results are pertinent:
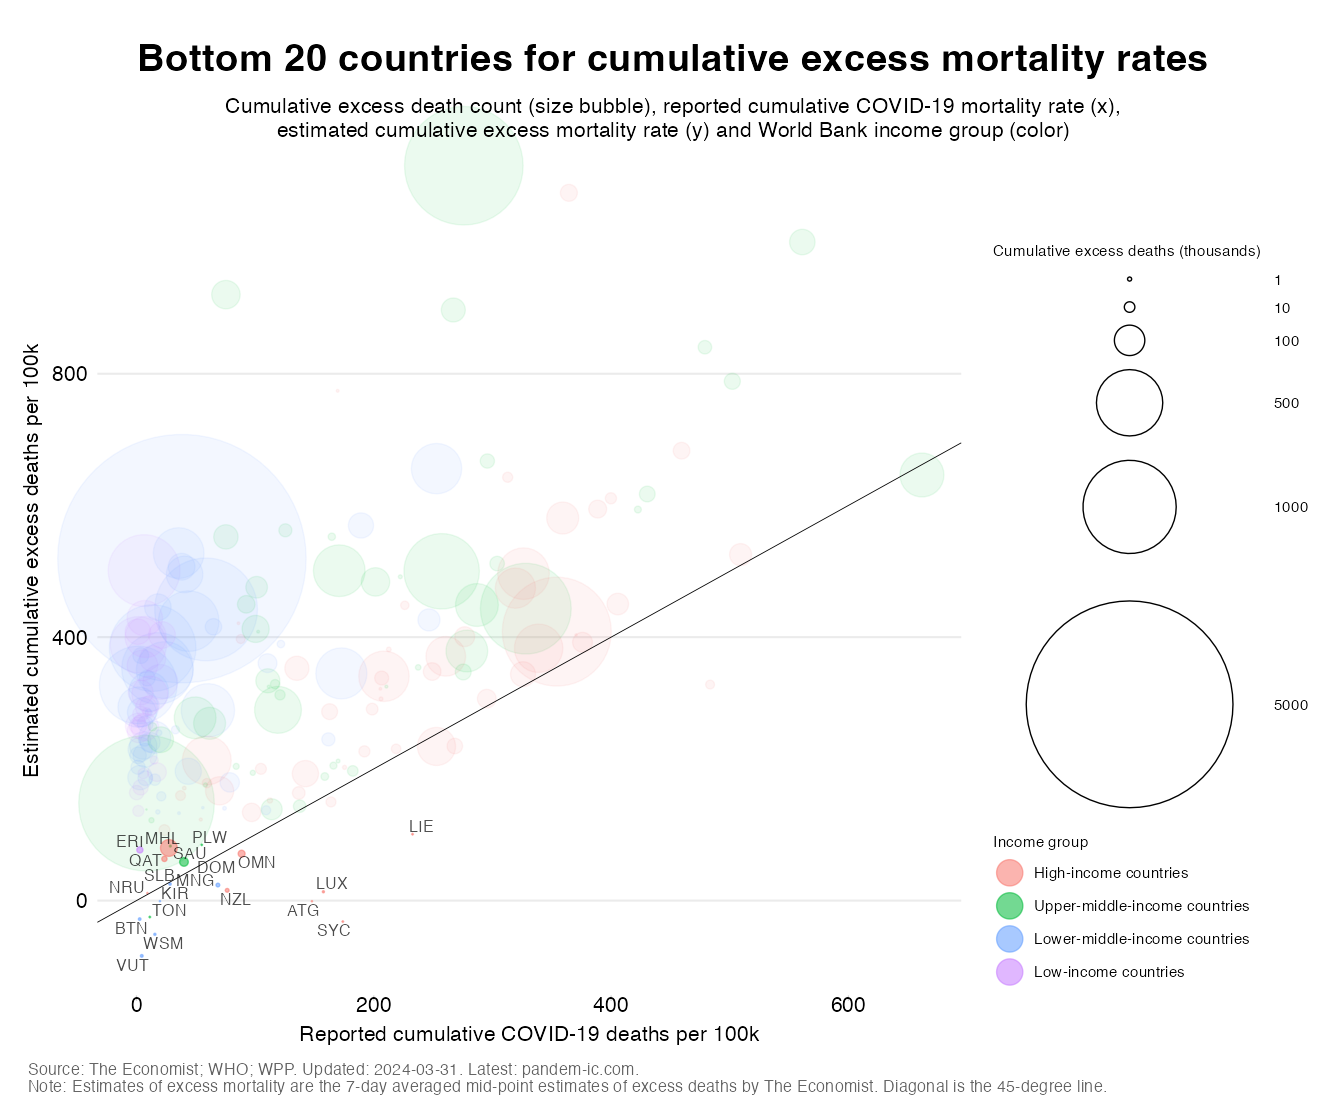
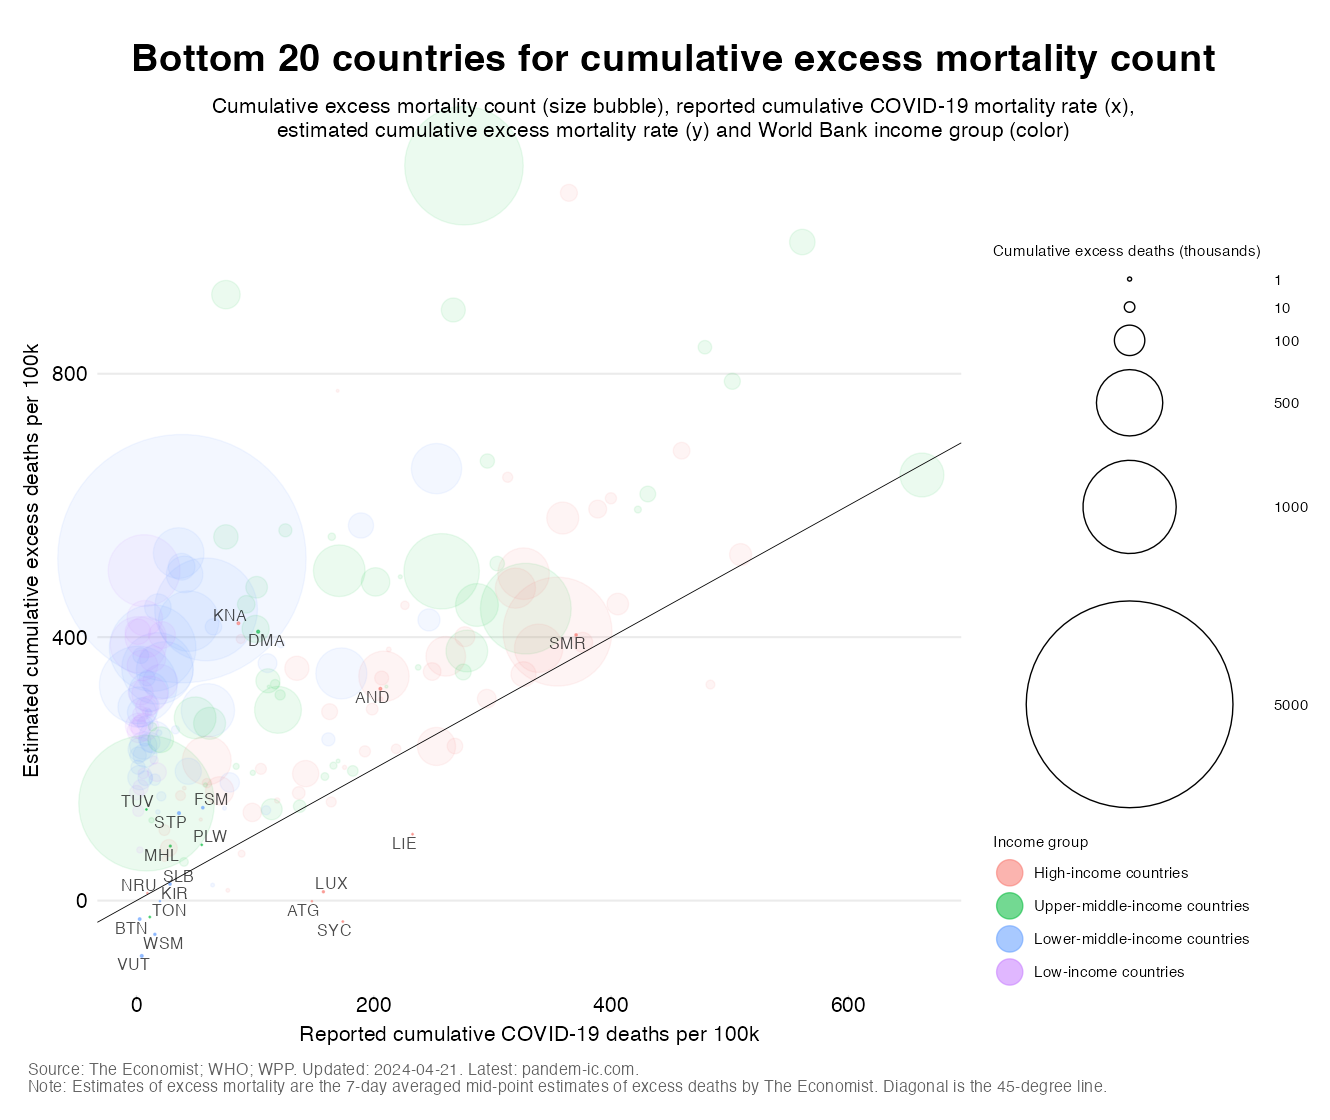
Let us now focus on a number of country outliers, where we distinguish between the Top and Bottom 20 for excess mortality rates and levels:
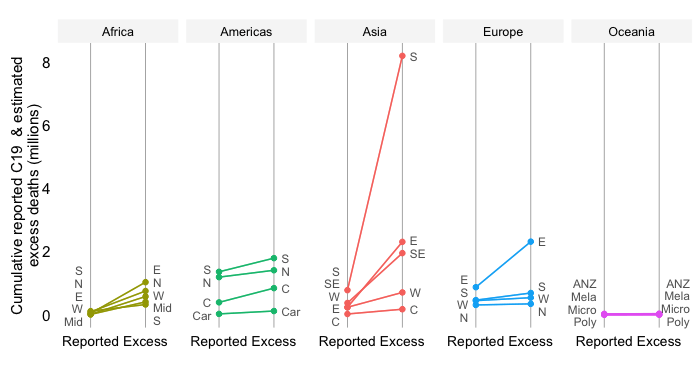
Let us now focus on the difference between cumulative excess death rates and officially reported COVID-19 death rates. First, we’ll focus on how this is derived from the mid-point estimates for excess mortality. Later on, we will look at the 95% confidence interval for the gap.
The chart below plots the difference based on mid-point estimates by World Bank income groups. The horizontal bars represent the income group population-weighted average, whereas the bubbles represent country observations. The size of the bubble relates to absolute cumulative excess death count.
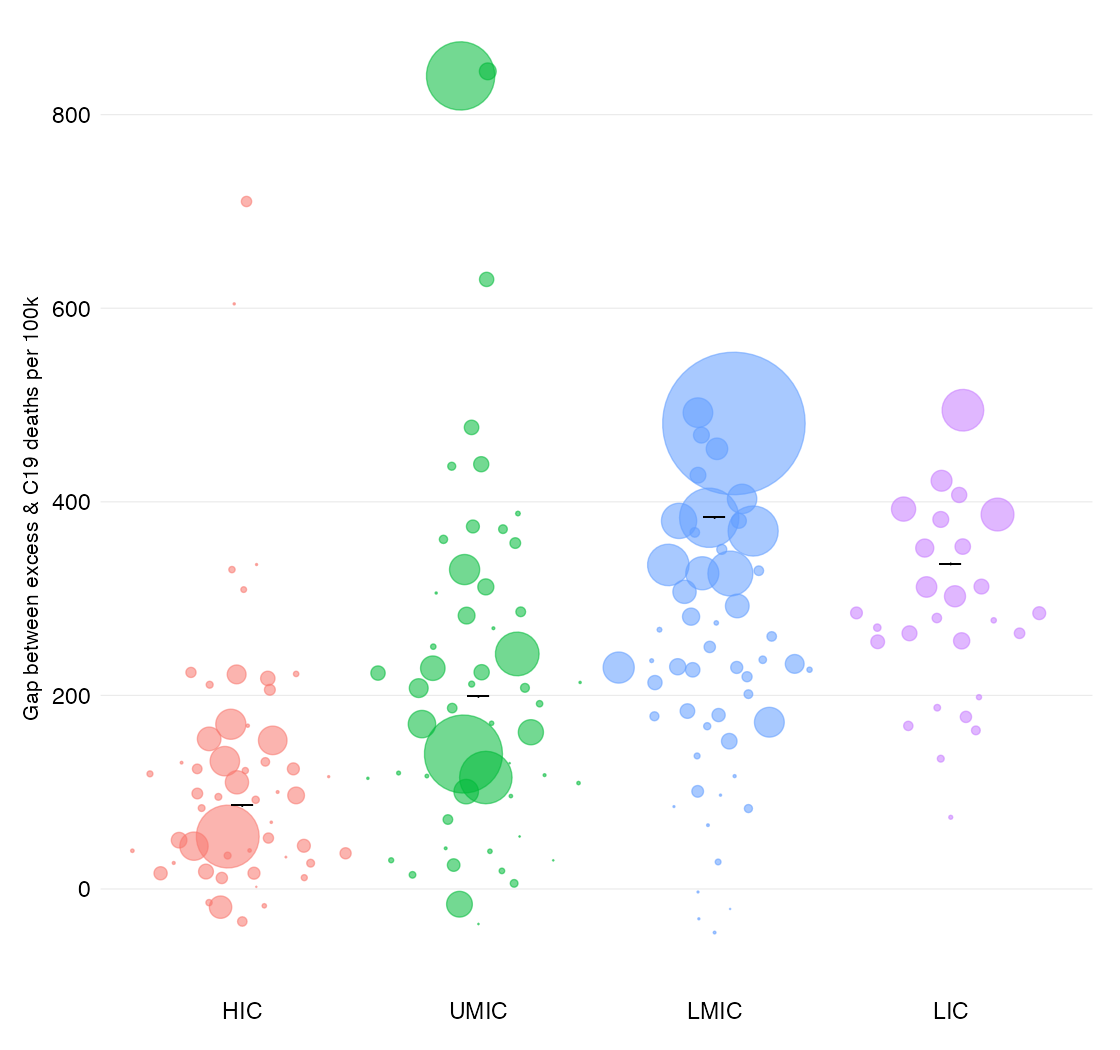
Several countries stand out with large gaps. Broadly speaking, however, the difference is lowest for HICs, then for LICs, UMICs and LMICs when we weight by population. Among countries with very large excess mortality counts, the difference is largest for India, Pakistan, Russia and Mexico.
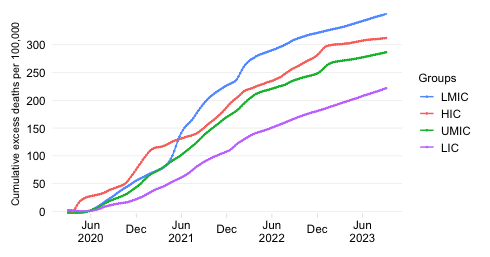
In all of the above, we have used mid-point values for the excess mortality estimates. In the below visualization, we expand the analysis to include the 95% confidence interval and show the evolution over time by income group.
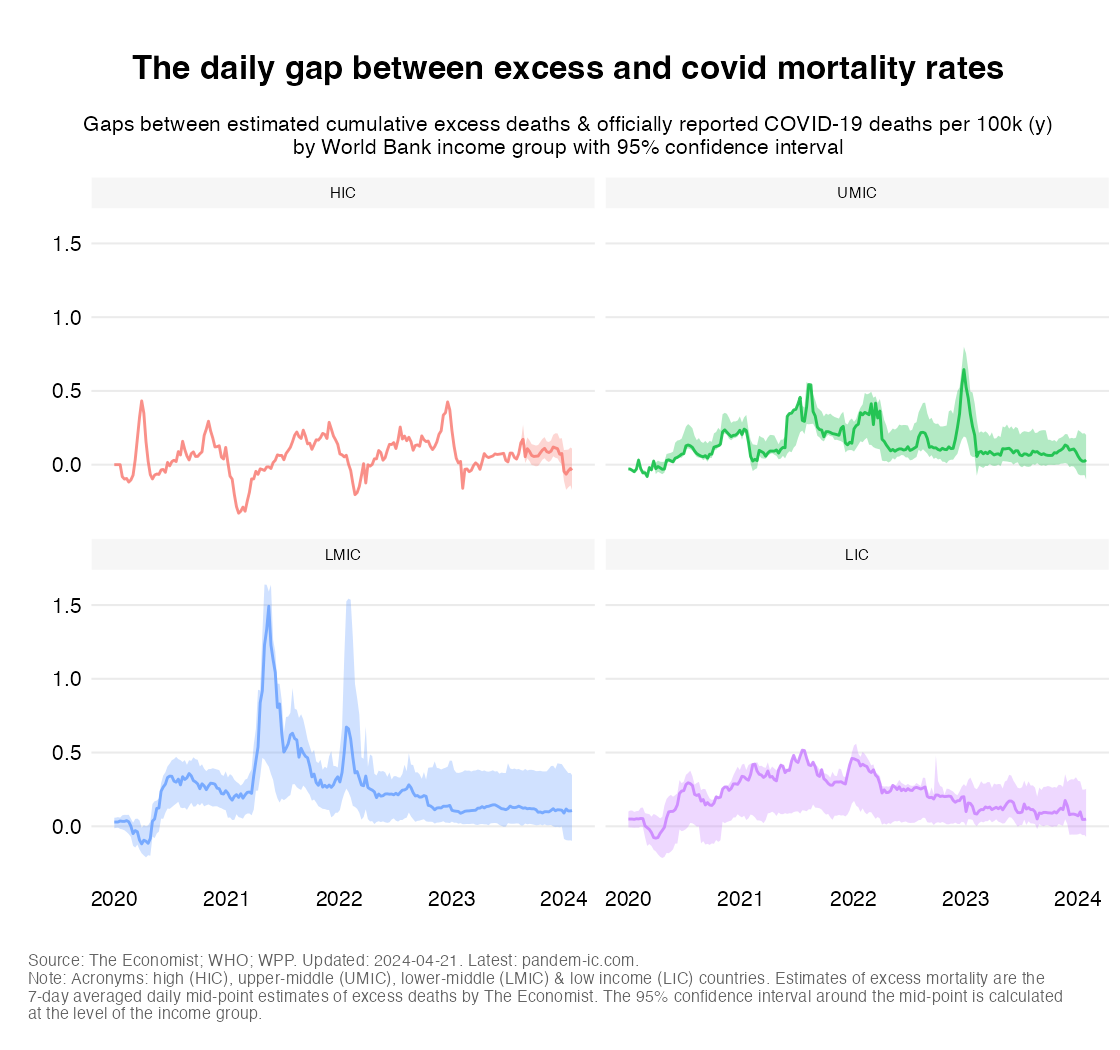
In the chart above, we show how the 7-day averaged difference between excess and covid rates has evolved over time, by income group and at 95% confidence. The largest fluctuations have happened in LMICs, which is driven mostly by the crisis in India May 2021. The band of uncertainty that reflects the 95% CI is however also especially large for LMICs. The same goes for LICs.
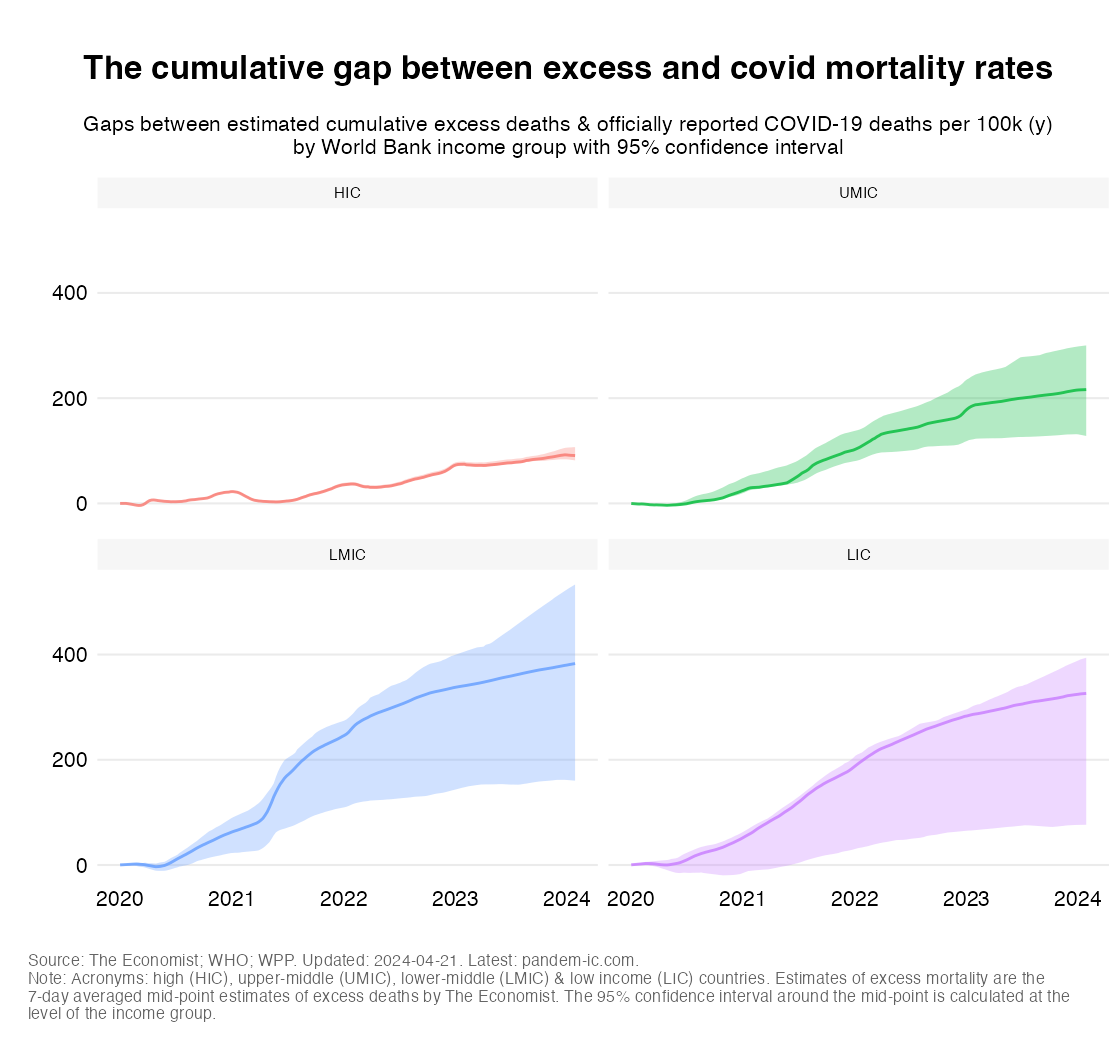
In the chart below, we plot the cumulative difference between excess and covid rates. Taking into account the uncertainty around the mid-points we can with high confidence state that the differences for HICs are a lot lower than those of developing countries (UMICs, LMICs and LICs). The UMIC differences are estimated with much greater precision than those for LMICs and LICs. The range for LMICs is so much larger than for other country groups. Half of the band of LICs overlaps with that of LMICs, even though we can state with high probability that the differences in LICs are lower.
The origins of the gap are multiple and relate to excess mortality offering a broader view on pandemic mortality by including deaths from all causes (not just COVID-19) that appear to be happening over and beyond what would be expected under “normal circumstances”.
Excess mortality thus accounts for “general equilibrium” effects that produce lower mortality as may be the case due to, e.g., the beneficial effects of distancing policies on other infectious diseases. By the same token, indirect mortality may rise if other diseases are undermanaged or even left unmanaged as medical resources are reprioritized towards COVID. In addition, excess mortality corrects to some extent for the effects of inequality of data quality, such as in the case where COVID deaths are incorrectly attributed to COVID.
Having said this, excess mortality estimates remain estimates. For one, they cannot be inferred directly and need to be derived by articulating a counterfactual for baseline “expected” mortality, which can go wrong in different ways. Second, for many countries it is not possible to derive excess mortality as all-cause mortality data is missing or not regularly available. The model of The Economist fills such data discrepancies on the basis of predictors that have worked elsewhere, but it suffices that such estimates are subject to uncertainty that may be especially large in the more data-poor environments. Third, the estimates rely on high-quality inputs on covid deaths, which in many countries are themselves estimates subject to a large degree of uncertainty. Fourth, there is model uncertainty as patterns in certain countries cannot be readily extrapolated to others due to potential biases.
These last two points are well recognized by The Economist, which noted here that:
“There are two main ways that our excess-death tallies could misrepresent reality. The first is that they rely on the assumption that officially published excess-mortality numbers are accurate. Given the disruption that covid-19 has caused, it is plausible that some governments may have changed how they compile data on total deaths during the pandemic. This might lead us to publish incorrect figures for the countries in question. It could also introduce errors into the estimates that our model produces for all other countries.
Second, because most countries that report excess deaths are rich or middle-income, the bulk of the data used to train our model comes from such places. The patterns that the model detects in these areas could thus be an inaccurate guide to the dynamics of the pandemic in poor countries. A similar caveat applies to our estimates for countries that have suffered lots of excess deaths for reasons other than the pandemic, such as war or natural disasters.”
We have seen a considerable expansion of excess mortality, especially since the beginning of 2021, that has been driven by developing countries. A large difference opened up between estimates of excess mortality and official reports of covid mortality, which in cumulative terms has led to large discrepancies across income groups and at the level of individual countries.
By and large, we see structurally higher differences in developing countries, but they have been driven by one-off events (such as May 2021) and remain subject to considerable uncertainty. Largely because of India, LMICs tend to have higher differences than UMICs. The differences in LICs appear to be similar to those of UMICs.
In percentage terms, of course, this means that LMICs and LICs, which together represent 52% of the global population, would see the largest boost to officially reported COVID rates if we are interested in capturing the true and total impact of the pandemic. This huge relative boost is happening despite the fact that these poorer countries typically have a very young population pyramid.
In conclusion, we see a huge variation in rates based on officially reported data. Officially reported data structurally underestimate the true toll of the pandemic. The degree to which it has done so – proxied by the gap measures shown in this post – varies as well across countries, but we can with confidence say that the cumulative gap between excess and covid mortality keeps on growing. That is because the distance between excess and covid mortality rates is far greater in the developing world – both in absolute terms and, for the poorer countries, in relative terms.
Disclaimer: Posts by the Center for Global Development reflect the views of the authors, drawing on prior research and experience in their areas of expertise. CGD is a nonpartisan, independent organization and does not take institutional positions. Likewise, views expressed do not necessarily reflect those of the United Nations, the United Nations Development Programme, its programmes/projects or governments. The designations employed do not imply the expression of any opinion whatsoever concerning the legal status of any country, territory or area, or its frontiers or boundaries.