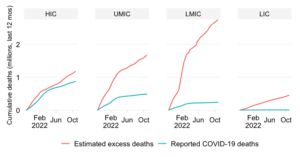
Much about the impact of COVID-19 is about demographics. Since this is an age-discriminating pandemic, we would expect a strong relationship between a country’s age structure and cumulative mortality outcomes. This post confirms this to be true in the officially reported data. But the picture of excess deaths suggests the opposite result, where for many poorer countries with young demographics excess deaths were elevated and comparable to richer countries with older populations.
Let us start with what the officially reported data on COVID-19 mortality tell us. We will first look at the simple cross-country relationship where all countries are compared on an equal basis. Next we will make population-weighted comparisons, which lend themselves more easily to interpretations about how country groups have performed.
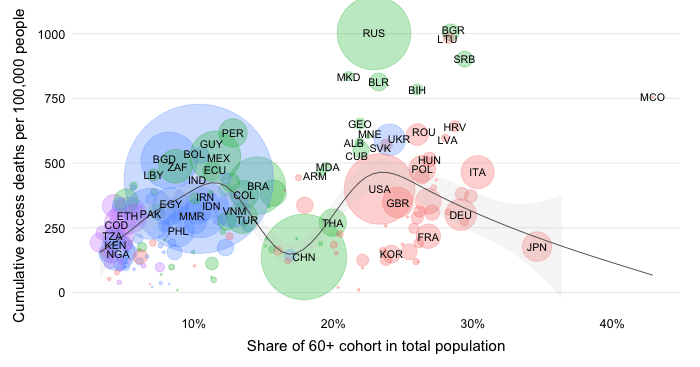
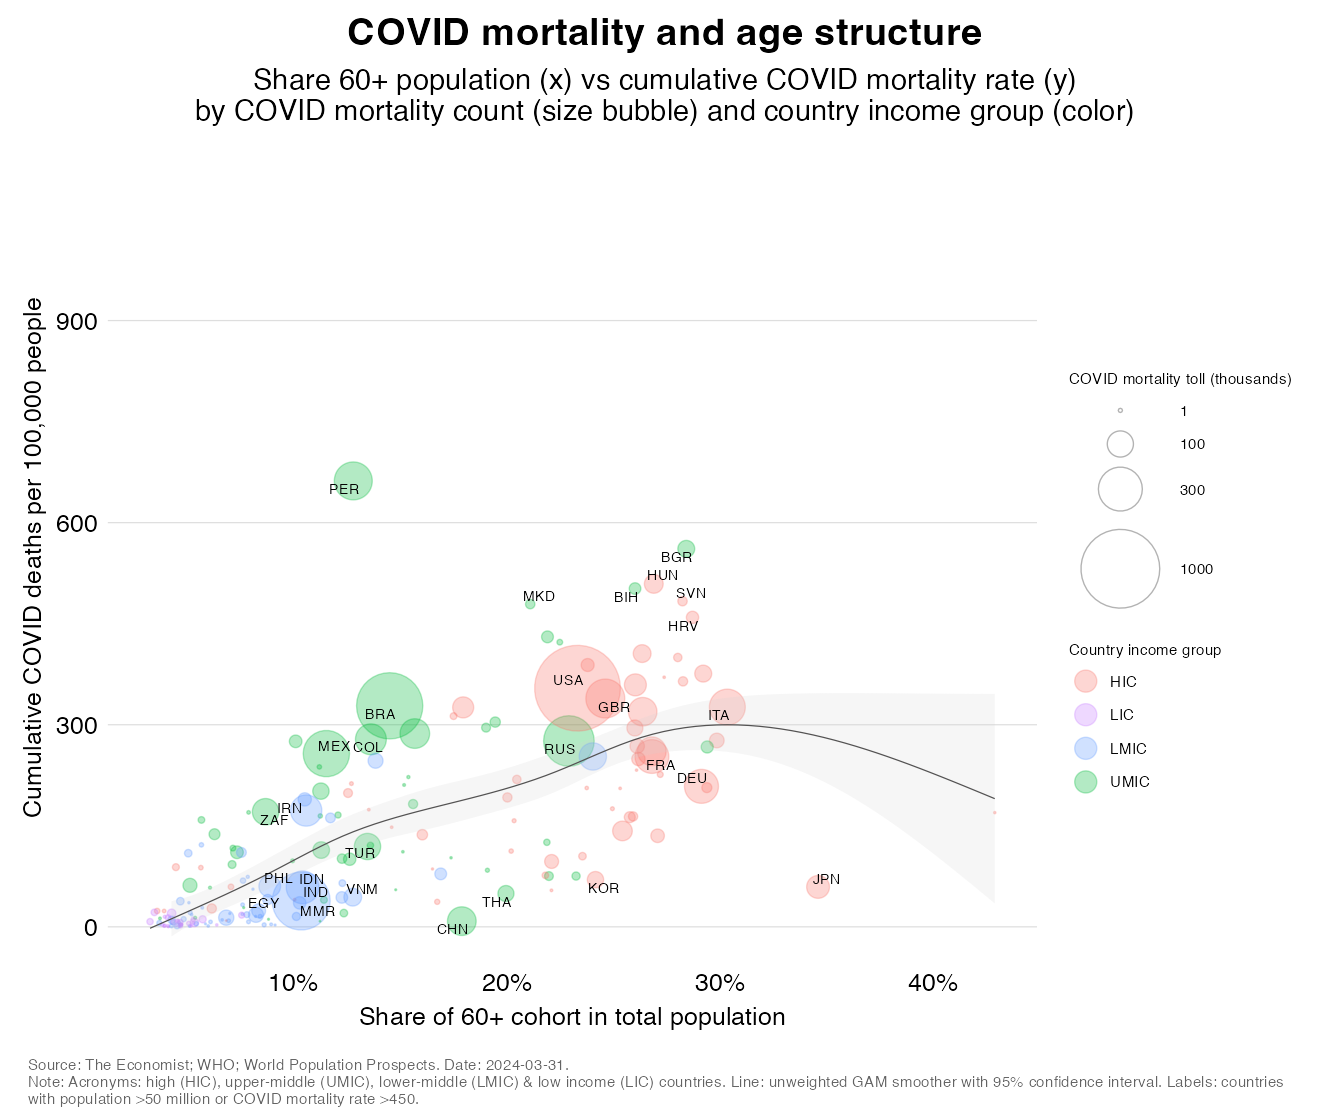
The chart below plots the population share of the elderly (who are taken to be the 60+) against the cumulative COVID-19 mortality rate as per official reports. The area of the bubbles represents the absolute mortality toll and colors refer to the World Bank income classification of high, upper-middle, lower-middle and low income countries (HICs, UMICs, LMICs and LICs). The regression line is not weighted by population and the shaded areas around is the 95% confidence interval.
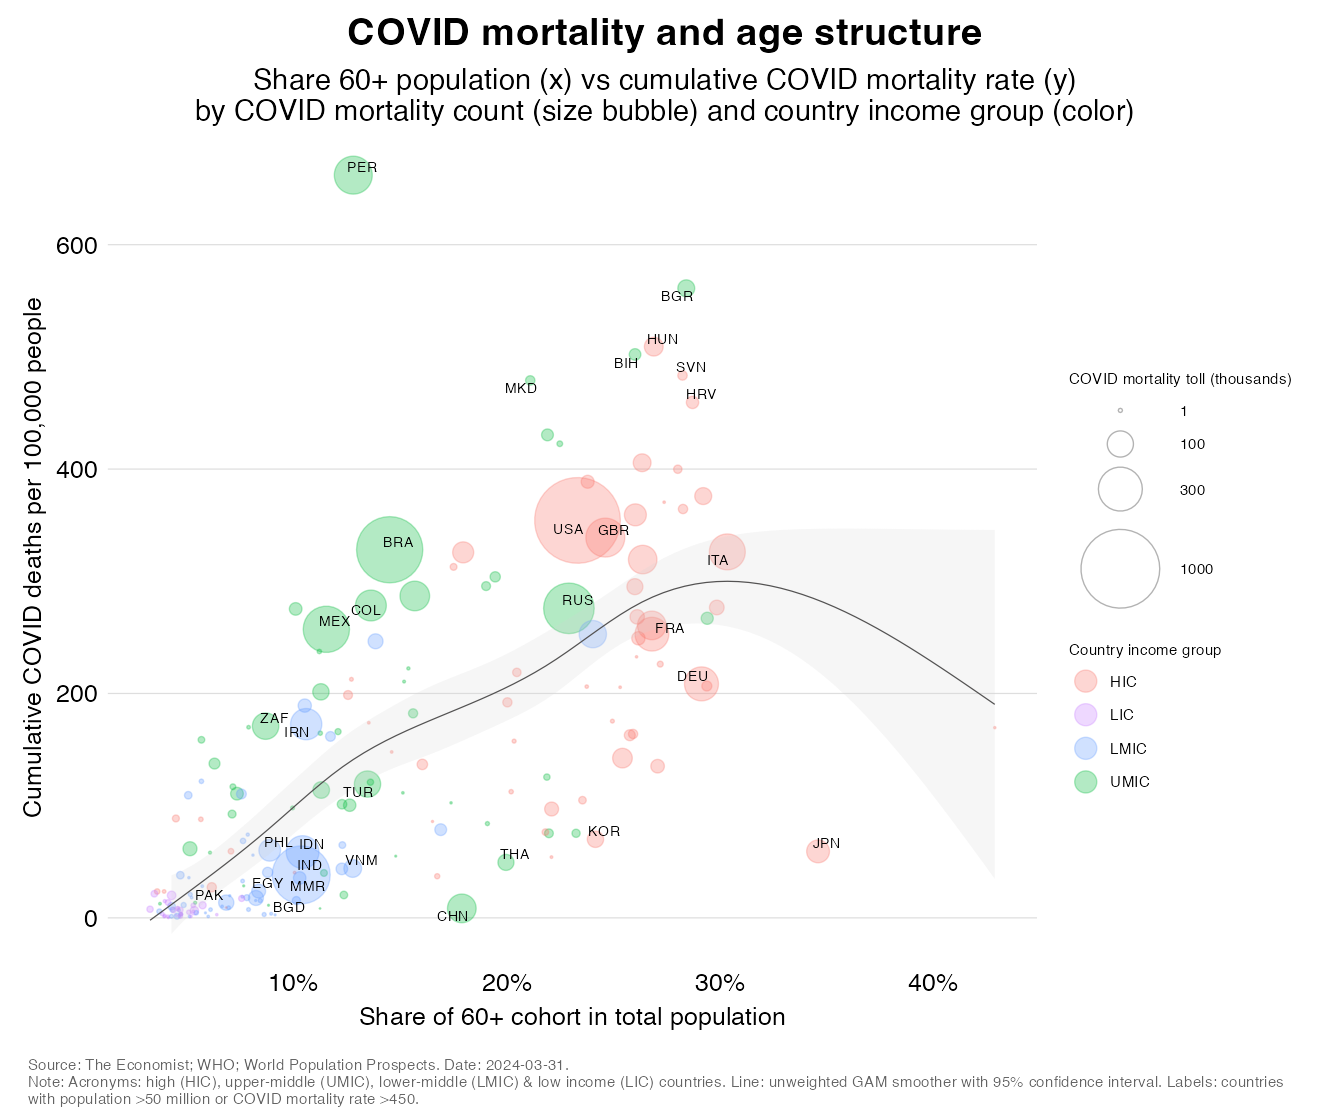
The chart suggests a strongly positive and statistically significant association between age and COVID mortality: the higher the elderly share, the higher cumulative mortality rates tend to be. It is no coincidence that the countries with high elderly shares are those that belong to the upper rungs of the income classification as demography and development are closely connected. Hence, we also see in the chart a positive relationship between elderly shares and income levels as demonstrated by colors that show country income groups.
It is also interesting to look briefly at the outliers in this chart – the countries that deviate considerably from the average.
Above the line, Peru stands out with the world’s highest mortality rate. This perhaps looks odd given the country’s young population but is partly explained by its practice of incorporating excess mortality estimates into its official reports of COVID mortality. Bulgaria, Hungary, Bosnia Herzegovina and North Macedonia all have mortality rates well above the regression line as do Brazil, Colombia, Mexico and to a lesser extent Iran and South Africa. Among countries with older populations, we also note that the US (which has the highest reported mortality toll), UK, Italy and Russia are above the line.
What we have shown so far depicts a simple regression line that minimizes the distance between countries no matter how big or small they are population-wise. But how would these results change if we attributed greater importance to the more populous countries?
After all, from a global welfare perspective (“a life lost is a life lost, regardless of borders”), we might be more concerned about a moderately low mortality rate in Vietnam than a moderately elevated one in Vanuatu. Not to diminish the tragedy of pandemic mortality in any country of course, but you get the picture: the population-weighted perspective provides an important complementary angle.
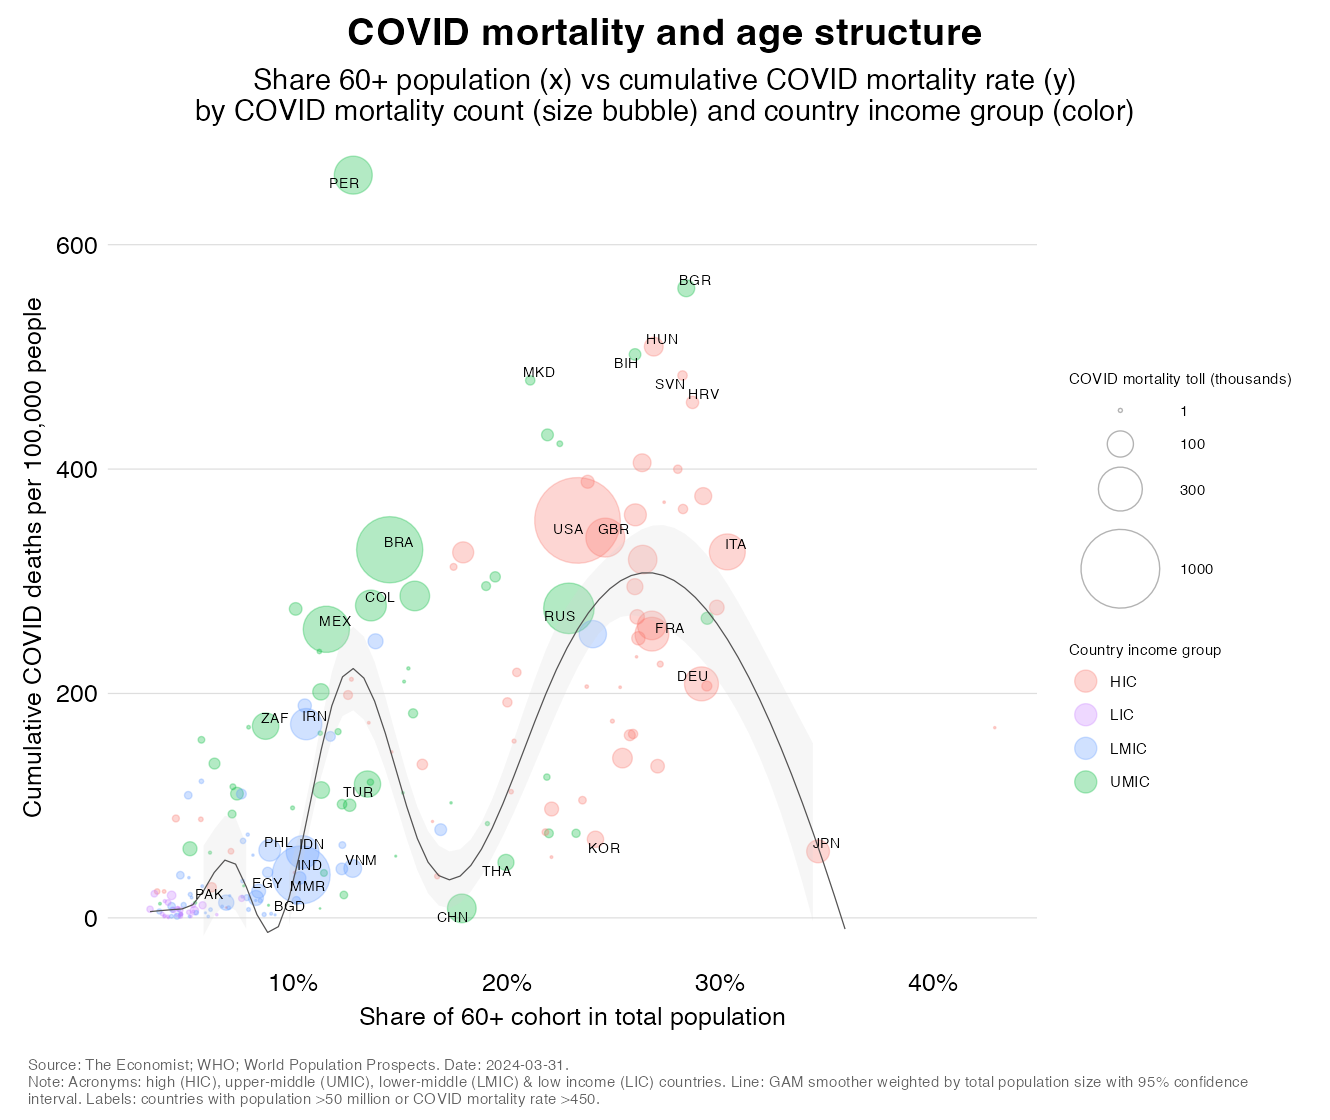
The above chart is an exact replica of the previous one with exception of the regression line which is now weighted by population. It shows us that the relationship between demographics and COVID mortality has become highly non-monotonic. In fact we see five segments in the relationship:
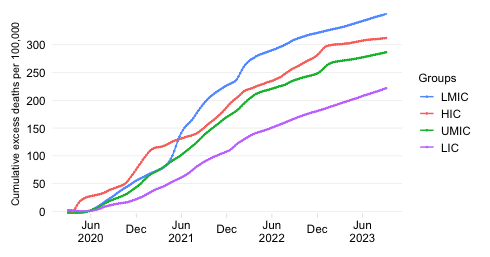
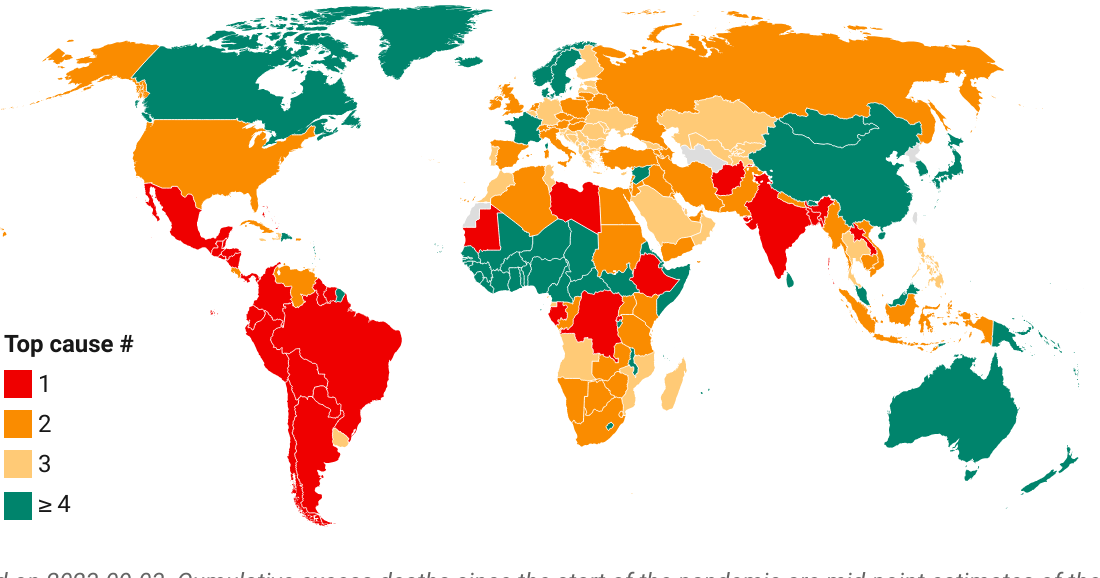
Excess mortality – the excess of all-cause mortality beyond what one would expect under normal conditions – is the gold standard for the assessment of the pandemic’s mortality toll. The concept helps correct for poor mismeasurement and account for indirect mortality impacts, which could be positive or negative. We utilize the mid-point estimates of the global excess death model by The Economist and show how these relate to age structure. We will do so again with simple unweighted regression lines and lines weighted by population size.
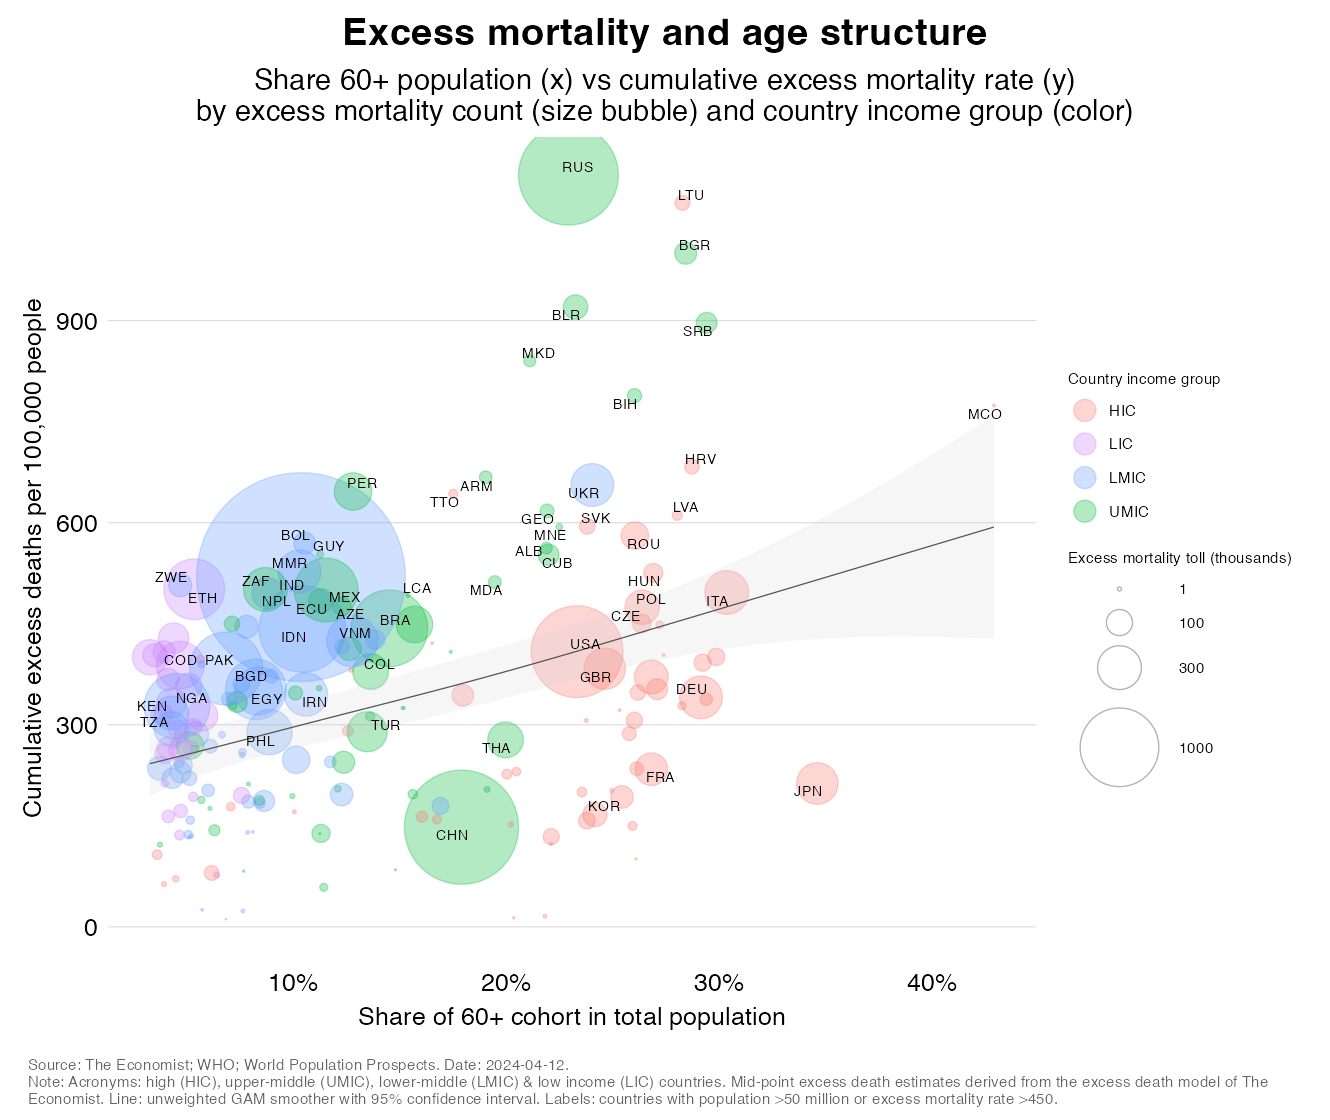
The chart below maps out the relationship between age structure and the cumulative excess mortality rate. The regression line is again the unweighted one and simply shows how countries compare irrespective their population size.

As with COVID mortality rates, age structure correlates strongly positively with excess mortality rates. But what is quite different in this chart is the scale of the y-axis. Indeed, excess mortality rates are far higher than COVID ones and the entire relationship appears to have shifted up (this is a point that we be visualized more clearly in the next section).
We also see interesting outlier patterns. Among large countries, Japan, China, South Korea continue to surprise on the downside, as do France, Germany and Thailand. Above the line, we see that Peru is still out there but no longer at the top spot, which is now occupied by Bulgaria. Note also the very high value for Russia.
The other aspect that catches attention is the size of the bubbles (which represents the absolute excess mortality toll and can be compared across charts as the scale for the size aesthetic is kept constant). The global picture is no longer dominated by the US. No, it is India which stands out heads and shoulders above the rest (in large part due to the escalation around May 2021). But it’s not just India; many more countries show large numbers now.
Let us now again repeat the above analysis but introduce the regression weighted by population.
The nonlinear picture that we saw with COVID rates re-emerges, but the peaks are now at different levels. China and Japan still pull the relationship down, as do a number of lower-income countries with extremely low elderly shares. But what is different is that there are now many more countries pushing the relationship up. This includes many LMICs but also several LICs and together their experiences generate a fundamentally different perspective on the relationship between age structure and excess mortality.
We will now make some direct comparisons between COVID and excess mortality insofar as it relates to age structure. But to do so we must make sure that the scale for the mortality rates is identical. The adjusted charts are shown in the carousels below, which cycle between the two concepts and illustrate the dramatic differences in a visually more appealing way.
The carousel below compares the unweighted relationship between age structure on the one hand and our two mortality concepts on the other. The carousel cycles between the two views (you can download static versions of the chart here and here). You can click on the arrow to cycle manually or just on the image to pause the loop.
The carousel below compares the weighted relationships of age structure with COVID and excess mortality rates. The weighted regressions will allow us to make inferences about how country income groups rank in terms of pandemic severity. And that is simply because statements about group averages are statements that are population-weighted.
The carousel brings out the two main points of this point:
This post has documented the relationship between demographics and pandemic mortality. Across countries, we see that the relationship is strongly positive for both COVID and excess mortality even though the intercepts are hugely different as excess rates are so much higher than COVID rates. At first, judging from the unweighted regressions, it appeared that the gap between the two is independent of age structure. In other words, as we shift from COVID to excess mortality, rates go up on average by about the same amount for all countries regardless of demographics. There are no fundamental alterations in pandemic severity across country income groups.
Population-weighted estimates suggest that this initial impression is completely false. In fact, the rise in excess rates is appreciably greater in the poorer countries that have lower elderly shares. This result can be explained by a combination of worse epidemiological odds (higher risk of infection and higher risk of death once infected) and worse indirect effects on all-cause mortality during the pandemic.
This result once again illustrates the disturbing picture about excess mortality in the developing world. In fact, developing country excess death rates are a lot higher than the demographic profiles of these countries would suggest. As a result, a good part of the disparity between the richer and poorer halves of the world is gone. And, no, the pandemic did not subvert global health: the typical pattern of an infectious disease dynamic affecting first and foremost the poorer nations still applies.
Disclaimer: Posts by the Center for Global Development reflect the views of the authors, drawing on prior research and experience in their areas of expertise. CGD is a nonpartisan, independent organization and does not take institutional positions. Likewise, views expressed do not necessarily reflect those of the United Nations, the United Nations Development Programme, its programmes/projects or governments. The designations employed do not imply the expression of any opinion whatsoever concerning the legal status of any country, territory or area, or its frontiers or boundaries.