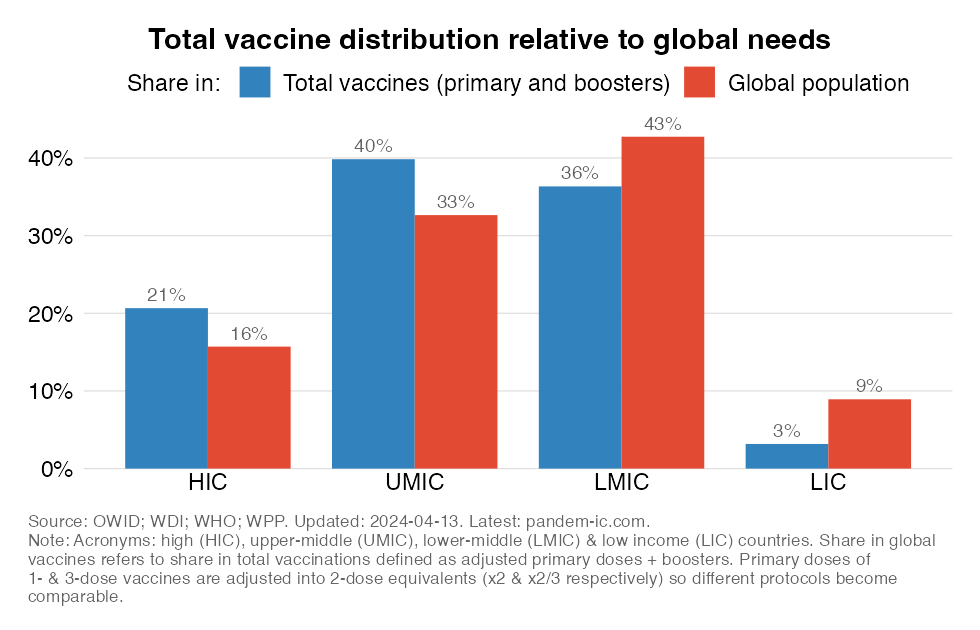
Share in primary & boosters doses globally vs share in global population by income
EXPLAINER
This chart shows the distribution across the World Bank income classification of (1) COVID-19 vaccine doses administered globally, including both primary doses and boosters and (2) the global population.
It illustrates the inequality in the distribution of vaccines relative to global needs. The comparison between vaccine distribution (the first bar for each income group) and population distribution (the second bar for each income group) provides another angle to the mismatch between supply and potential demand (potential as this does not take into account vaccine hesitancy).
Vaccine doses administered refer to total vaccinations, which are defined as adjusted primary doses + boosters. Primary doses pertain to the initial vaccination cycle and are adjusted to take into account the diversity of vaccine protocols. Primary doses of 1- and 3-dose vaccines are adjusted into 2-dose equivalents, which amounts to multiplying them by 2 and 2/3, respectively, before adding them up. This method, further detailed inthis post, makes sure that we make correct comparisons across countries and country groups in the doses space.