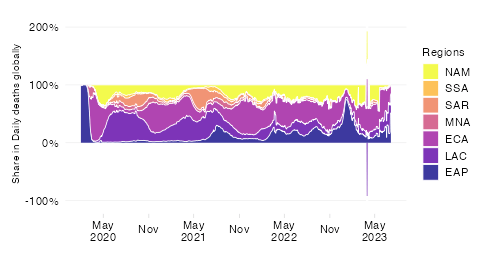
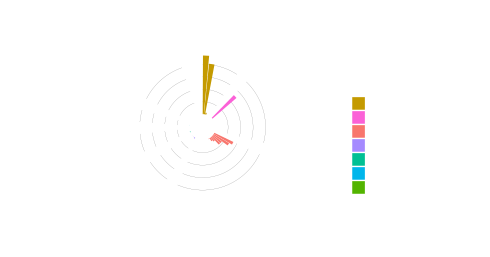
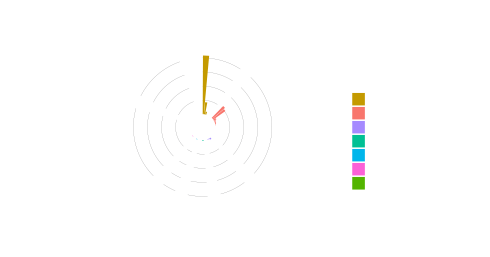
Share in cumulative deaths by World Bank region (last 12 months)
Updated daily
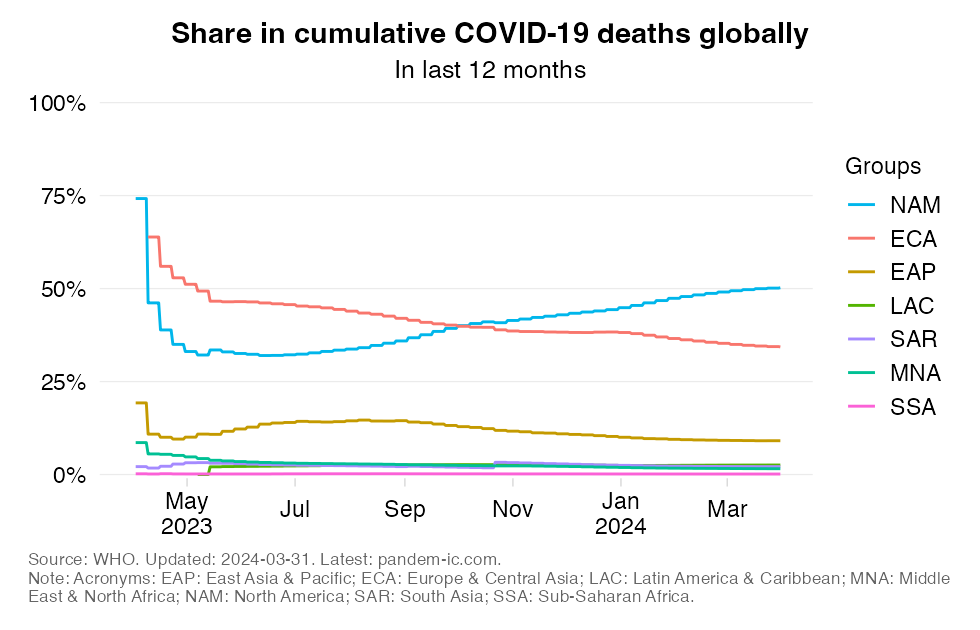
Share in cumulative confirmed COVID-19 deaths (last 12 months)
EXPLAINER
This chart shows the evolution over time of the distribution of cumulative COVID-19 mortality across World Bank regions. It calculates for each region the share in cumulative COVID-19 mortality globally in the last 12 months.
The indicator reflects an absolute concept of mortality in that it expresses how the absolute death toll in a particular region contributes to the global death tally. This differs fundamentally from the concept of the mortality rate, which expresses the absolute toll relative to population size and thus provides an indication of performance controlling for population size. The absolute numbers underpinning the mortality distribution shown here take the view that a life lost is a life lost, no matter where the person happened to live. It offers a valuable perspective on the absolute scale of the pandemic’s death toll.
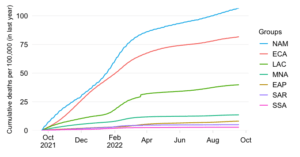
It should be noted that the different regional groups shown here are of very different population size dimensions. The global population as per the 2021 medium-variant projection of World Population Prospects is 7,866 million people, which is distributed as follows:
East Asia & Pacific (EAP): 2,392 million
Europe & Central Asia (ECA): 930 million
Latin America & Caribbean (LAC): 655 million
Middle East & North Africa (MNA): 472 million
North America (NAM): 374 million
South Asia (SAR): 1,877 million
Sub-Saharan Africa (SSA): 1,166 million
In light of these differences in population size, we expect large differences in the distribution of absolute mortality even if mortality rates were constant across groups.