Pandemic excess mortality compared with pre-pandemic mortality patterns
EXPLAINER
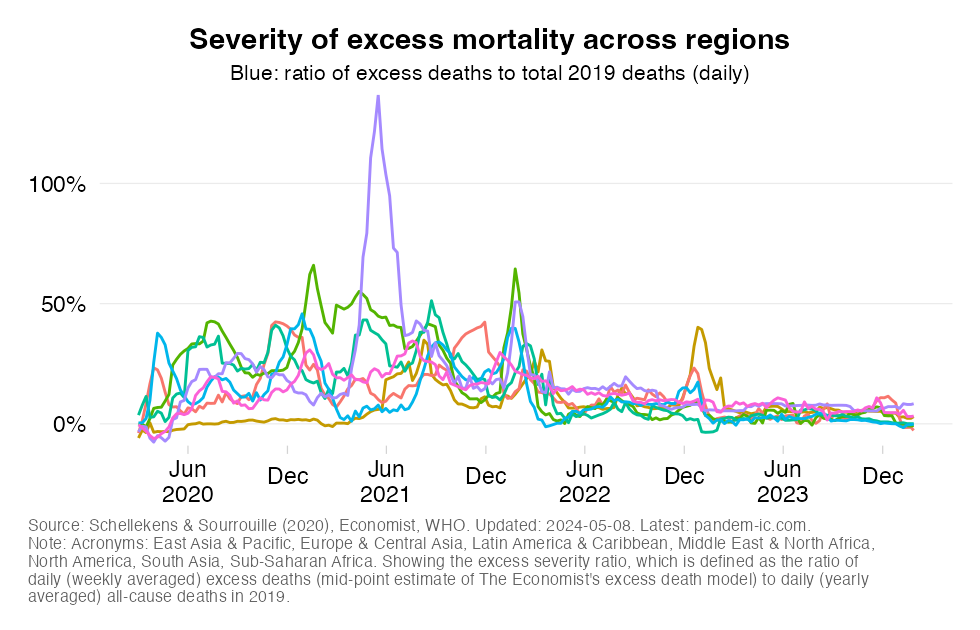
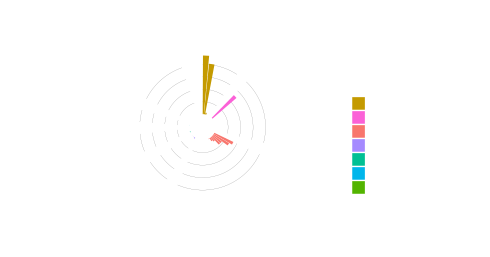
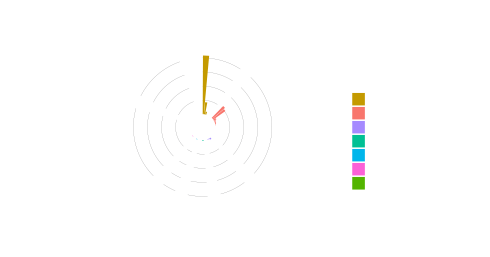
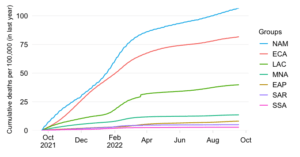
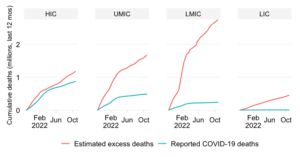
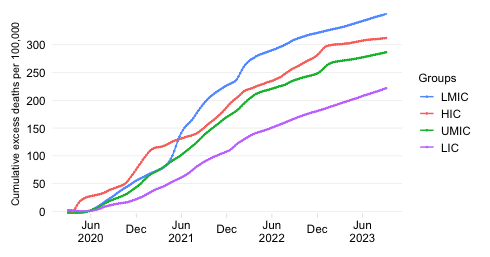
This chart shows the evolution over time of the ‘excess severity ratio’ across World Bank regions.
The excess severity ratio relates excess mortality accrued over the course of the COVID-19 pandemic to the level and profile of pre-pandemic mortality. The ratio itself is defined simply as the ratio between (1) the total number of estimated daily excess deaths (averaged over the course of a week) and (2) the total number of reported daily all-cause deaths in 2019 (averaged over the course of a year). Note that all-cause mortality from 2019 is averaged yearly in the interest of having a globally comprehensive sample.
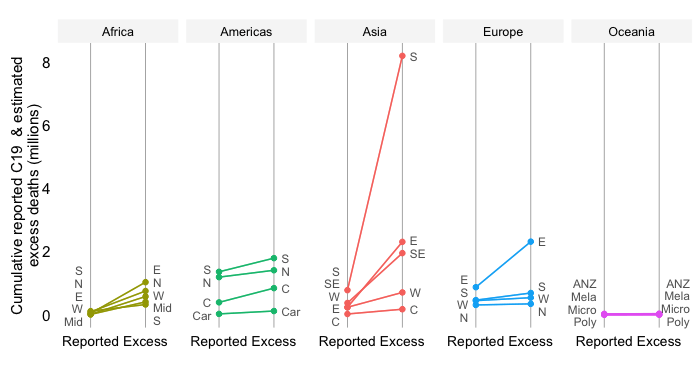
The excess death estimates are derived from the excess death model by The Economist. We use the mid-point estimates that their model generates. Note that there may be a wide band of uncertainty around these estimates.
The excess severity ratio thus makes a comparison with the level of 2019 mortality. It compares excess mortality during the pandemic with all-cause mortality in 2019 over the same interval of time. If the ratio is, say, 10% then we can say that excess mortality corresponds in magnitude to about a 10th of the dying that happened in 2019 over a similar interval of time.
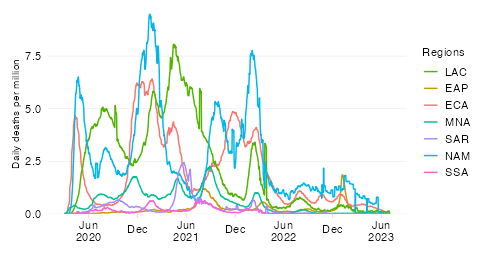
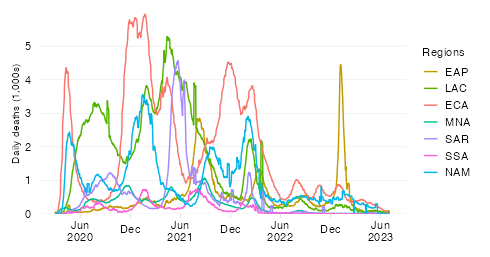
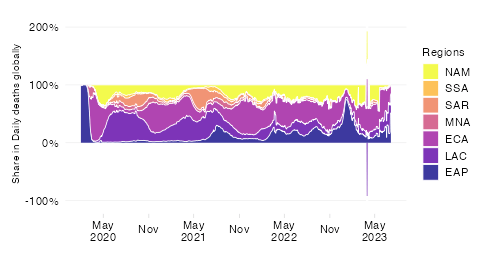
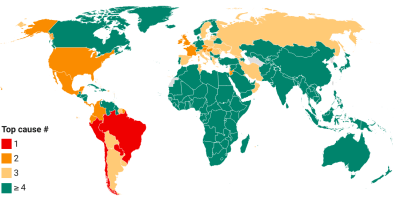
In the above chart, we focus purely on the evolution of the excess severity across World Bank regions and don’t make any comparisons with the top causes of death in 2019. See the related charts below for such comparisons.
Note that the expression of mortality in relative terms is a useful way to communicate the severity of the pandemic. Countries will have adapted to their specific patterns of mortality. Deviations from this pattern may create pressure points, such as on the health system. Comparisons with previous patterns give a country-specific and intuitive flavor of the severity of the COVID-19 pandemic. A statement such as “the excess mortality toll currently amounts to more lives lost than the loss of life due to the top cause of death n 2019” may convey a better feel for the severity of the pandemic than a reference to a crude mortality rate (total deaths per 100k people).