Urbanization and vaccination

Philip Schellekens  |  
Slower COVID-19 vaccination progress in lowly-urbanized countries reflects the common influences of development level, logistics and other factors

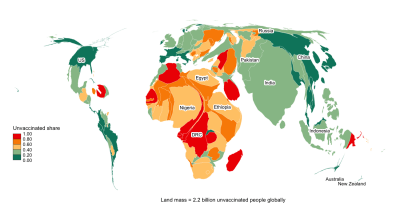
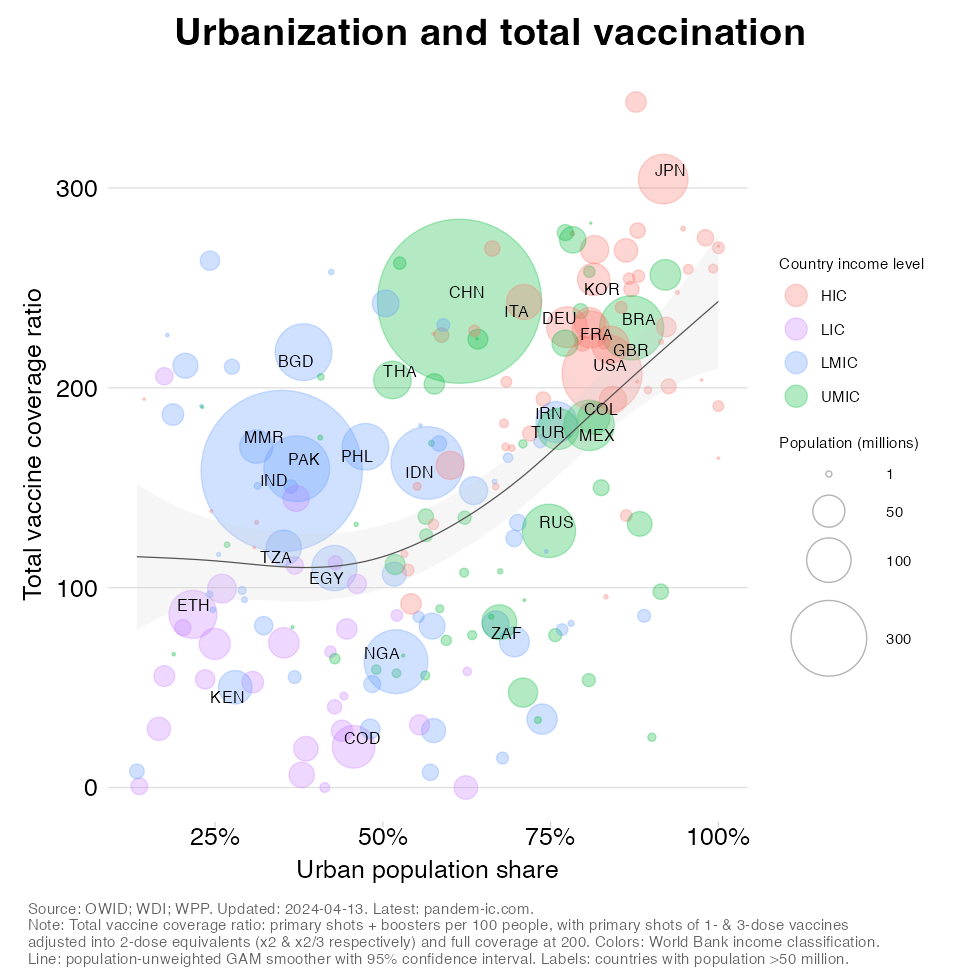
Urbanization – the share of urban in total population – appears to be one of the factors that associates well with COVID-19 vaccination progress. Predominantly rural countries tend to be poorly vaccinated; conversely, predominantly urban ones tend to be better vaccinated.  This positive relationship is not unexpected as a powerful common factor is at play: the level of development. But there is more to it than that and other factors such as the greater logistical challenge of reaching everyone in less urbanized settings play a role too.  

Contents

A positive relationship with two major outliers

The visualization below plots a country’s urbanization rate against the COVID-19 total vaccine coverage ratio. The latter is a composite indicator that consists of the sum of primary doses and boosters administered per 100 people, where primary doses have been converted into 2-dose equivalents. This conversion amounts to multiplying doses of 1-dose vaccines by 2 and doses of 2-dose vaccines by 2/3, so as not to underestimated vaccination progress for the former and overestimate for the latter. With this transformation, maximum primary coverage is reached at 200 adjusted doses per 100 people. 
 
Other features of the visualization are the four colors, which represent World Bank income groups: high, upper-middle, lower-middle and low income  countries (HICs, UMICs, LMICs and LICs). Since both axes are expressed relative to population, we also add a measure of scale: the areas of the bubbles represents absolute population size. We also add a regression line – a GAM smoother – which in the first visualization will be unweighted by population (so it searches for the best nonlinear fit between the observations as they present themselves and thus without population adjustment). Finally, we add a country code label to the countries that have a population over 50 million. 
The chart illustrates that countries with low urbanization rates are more likely to be poorly vaccinated. A high rural share correlates strongly with less vaccination progress, where we consider both primary and booster doses. Initially, the relationship appears rather but it becomes quickly strongly positive: high urbanization, higher vaccine coverage. 
 
One drawback of the above chart is the the regression line is insensitive to population size. In other words, a country as small as Tuvalu would carry the same importance in determining the shape of the line as a country as large as China. Instead, we could run a population-weighted regression line, where the shape will be sensitive to differences in population size across countries. That is what the chart below accomplishes.
China and India are outliers in both population and vaccination dimensions. As to vaccine coverage, China has stood out throughout the pandemic for its vaccination performance. It performed better than most UMICs and indeed most countries, in large part thanks to the country being a prolific vaccine manufacturer. As we have noted elsewhere, being a vaccine manufacturer helps with vaccine coverage of the population. A similar story applies to India, which is also a major vaccine manufacturer and has outperformed most of its LMIC peers. 
 
The population-weighted regression line shows major discontinuities as a result. As we proceed upwards starting from the lowest urbanization rates, vaccine coverage ratios rise – largely because of India (IND) but also a few other LMICs such as Bangladesh (BGD), Pakistan (PAK) and Vietnam (VNM). As we go further, the Democratic Republic of Congo (COD) and Nigeria (NGA) pull the weighted line down. Moving further it rises dramatically due to China (CHN), but subsequently drops again due to South Africa (ZAF) and Russia (ZAF). Once we reach the urbanization levels of HICs, vaccination levels rise again dramatically. 

A dynamic perspective on urbanization and vaccination

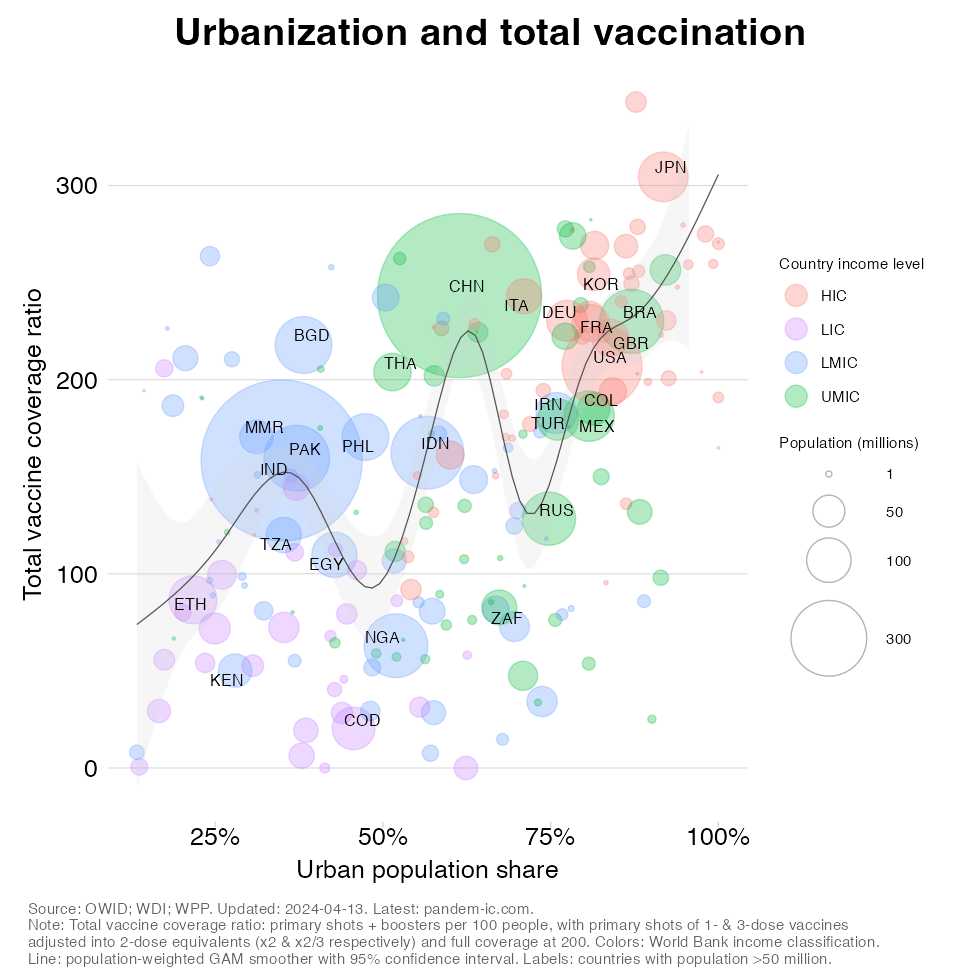
In what follows, we present the evolving relationship between urbanization and vaccination progress over time. We will let time run from the beginning of the global vaccination campaign, which we take to be December 2020, and let it pass in 2-week increments up to the present day. The regression line is weighted by population. The chart is otherwise the same as the ones presented before.

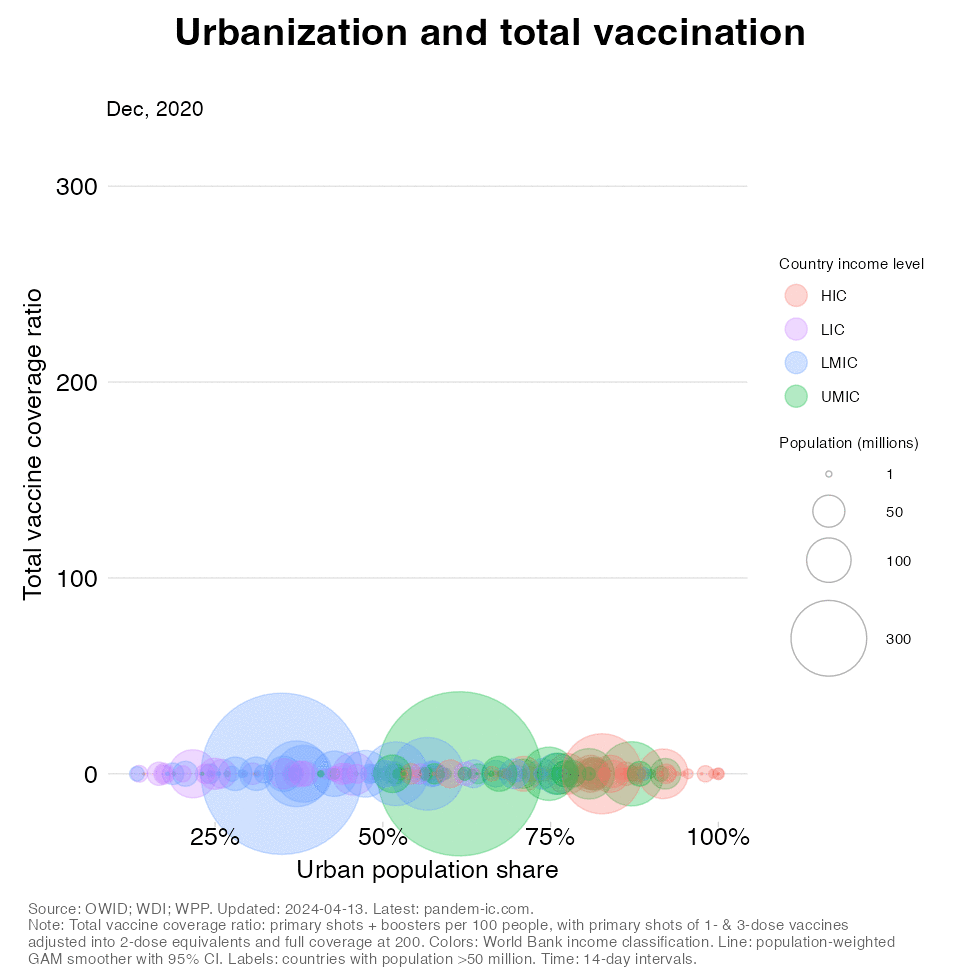
The dynamic visualization confirms the broadly positive but discontinuous relationship. It shows that, initially, when the primary series was rolled out, the low-urbanization countries made little headway, with exception of India, which dramatically pulls up the average. The progress made by China is spectacular throughout the visualization. As a result, the discontinuities discussed before carry through the entire time period. It is as if the relationship steepens somewhat initially but then gradually shifts up. 

Not unexpected, but with a twist

The finding that urbanization correlates with vaccination progress generally positively, though not perfectly, does not come as a surprise. We would expect some explanatory power from urbanization, but there is a twist.
 
We know that urbanization is a reflection of development. As countries become more prosperous and move up the country income ladder, the process of structural transformation they undergo typically includes a pronounced rise in the urban population share. We can see this pattern clearly, with urbanization rates generally rising as the color code in the chart shifts from low to high income. 
 
The twist is that low vaccination rates are not only associated with low levels of urbanization simply because countries are poorer. We would also expect that countries with a larger share of the population living in rural areas may face greater logistical difficulties in reaching the unvaccinated. Such logistical challenges tend to be amplified by population size, which correlates with country size. That provides another channel for the positive association between urbanization and vaccination. 
 
We can think of also other factors that may play role: urban-rural connectivity and rural density. Urban-rural connectivity in the broader sense (i.e. reflecting not just logistics but also how easily information spreads) will also reflect the level of development, but for a given level of connectivity we would expect that having a proportionately larger share of the population living in the countryside will prove to be a greater challenge of vaccinating everyone. The same goes for rural density, where it should be noted that a major difference between India and many Sub-Saharan African countries is that rural density is high in the former and much lower in the latter.
 
One could also argue that less urbanized countries might be facing lower risks of getting infected, keeping all else equal. In substance, this argument may not hold over the longer term, as the coronavirus appears to have found its way to the remotest of corners in the world (see eg here for a within-country perspective and here for the cross-country equivalent). But the argument may nevertheless hold relevance if the perception of being less vulnerable due to a largely rural population reduces the incentive to vaccinate. 

In sum

The positive association between urbanization and vaccination reflects the common influence of the level of development, which tends to raise both urbanization and vaccination. It also reflects the lesser logistical difficulties to vaccinate everyone in more urban settings. And a host of other factors may have contributed to the positive relationship, including urban-rural connectivity, rural density and perceptions of reduced vulnerability due to remoteness.

Two important outliers pull the averages up: China and India. These population giants have outperformed on vaccine coverage relative to countries at similar levels of development and similar levels of urbanization. This partly reflects their special status as vaccine manufacturers, which has been shown to benefit domestic vaccine coverage. 

Disclaimer: Posts by the Center for Global Development reflect the views of the authors, drawing on prior research and experience in their areas of expertise. CGD is a nonpartisan, independent organization and does not take institutional positions. Likewise, views expressed do not necessarily reflect those of the United Nations, the United Nations Development Programme, its programmes/projects or governments.  The designations employed do not imply the expression of any opinion whatsoever concerning the legal status of any country, territory or area, or its frontiers or boundaries.  

Share
Visuals