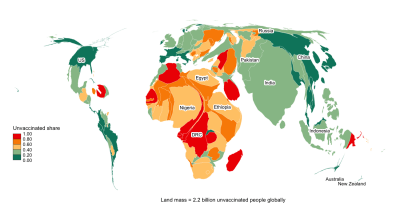
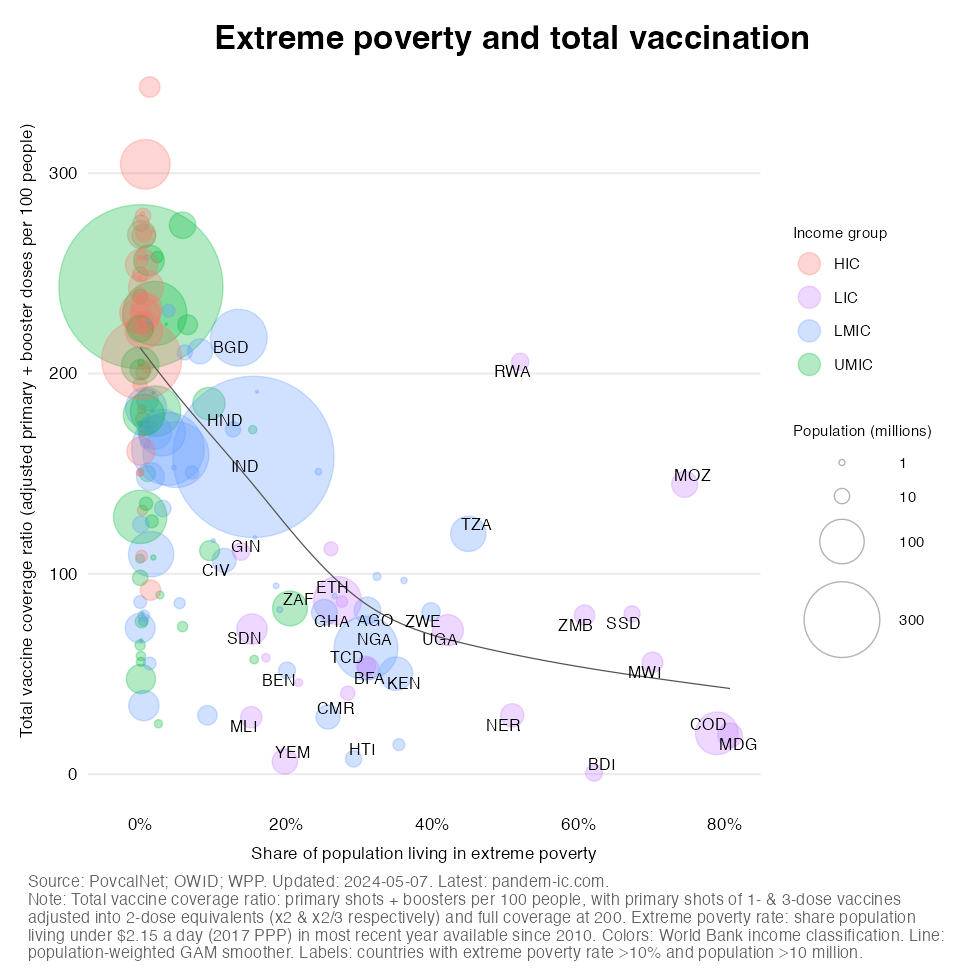
Extreme poverty and vaccination appear to be strongly inversely related. By now, 16 billion doses of the coronavirus vaccine have ended up in arms worldwide. But the distribution of these doses remains highly unequal. The poorest countries with the highest share of the population living in extreme poverty turn out to those most deprived of vaccination.
We explore the association between extreme poverty and vaccination. The extreme poverty rate captures the share of the population living on less than $2.15 a day at 2017 international prices as per the latest data point (within the last 10 years) as per the World Bank’s PovcalNet.
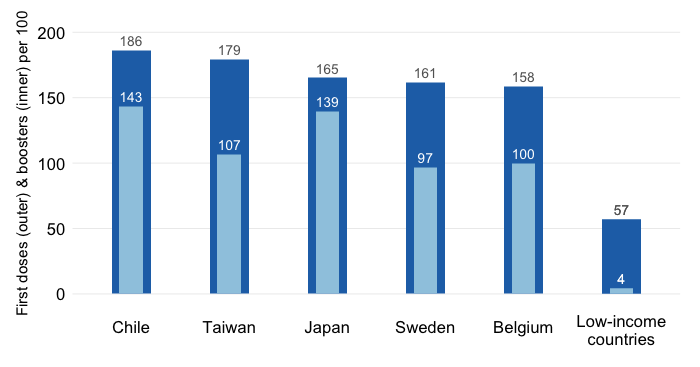
For vaccine coverage we look at total vaccine coverage: the ratio of the sum of adjusted primary doses and boosters to the total population. Primary doses are adjusted to correct for the diversity in vaccine protocols: we put all vaccines on an equal 2-dose footing and multiply doses of 1- and 3-dose vaccines by 2 and 2/3 so that full primary coverage is achieved at 200 doses per 100 people.
The visualization below also controls for population size (the area of the bubbles). Note how China and India pop out. And it also controls for country income levels. We use the World Bank income classification, which divides the world into high, upper-middle, lower-middle and low income countries (HICs, UMICs, LMICs and LICs). The classification approximates the level of development of nations, which will correlate with a host of other characteristics.
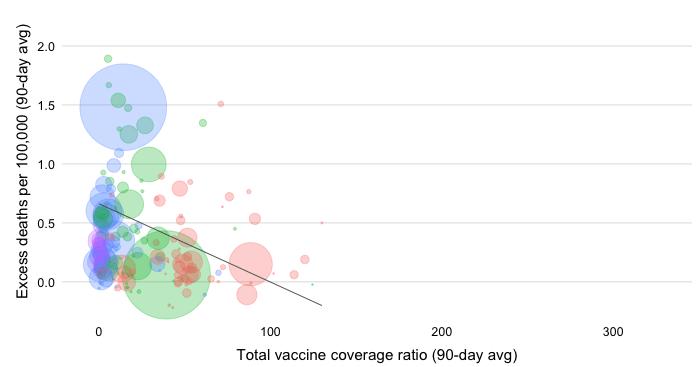
One final feature of the visualization is the regression line. This is a generalized additive model (GAM) smoother weighted by population. The relationship is therefore strongly affected by population outliers China and India which have performed well on vaccination compared to countries with high extreme poverty rates.
The following results are striking:
Conversely, and this is the point of this visualization, virtually all countries with non-negligible extreme poverty rates, have lower vaccination rates . Note how India pulls up the population-weighted regression line (due to both its large population and its relatively better vaccination performance compared to its peers). But if we exclude India and a few others (Bangladesh, Colombia, Honduras and Nepal) among those labelled with extreme poverty over 10% and a population over 10 million, the sizable vaccination gaps come through very clearly.
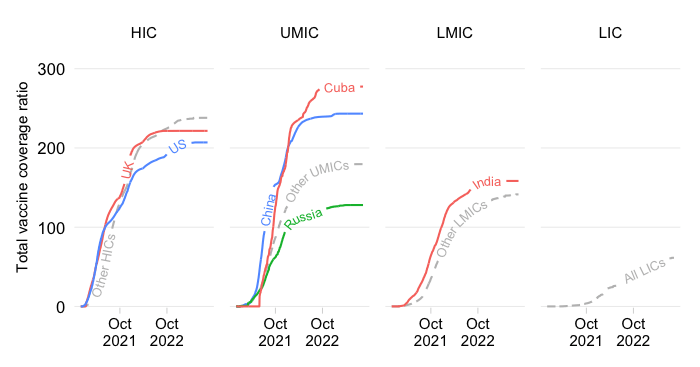
We will visualize the association between extreme poverty and vaccination dynamically. December 1st, 2020 marks the start date and the visualization runs through to the current date (which should be today, since all data insight posts on pandem-ic are updated daily). To keep the size of the gif down, we let time progress by 14-day intervals. When the gif reaches the last data point (today’s), the visualization labels those countries that have an extreme poverty rate above 10% and a total population above 10 million – and that is essentially the visualization of the previous section.
One point clearly emerges from the dynamic visualization: it is that the poorer countries have lagged considerably over the course of the pandemic. Their pace of vaccination progress differs markedly from the rest of the world. Indeed it is precisely the countries with significant extreme poverty rates that performed worse in getting their populations vaccinated. This affects all LICs in the sample (except Rwanda), many LMICs as well as a few UMICs (including South Africa among the larger ones).
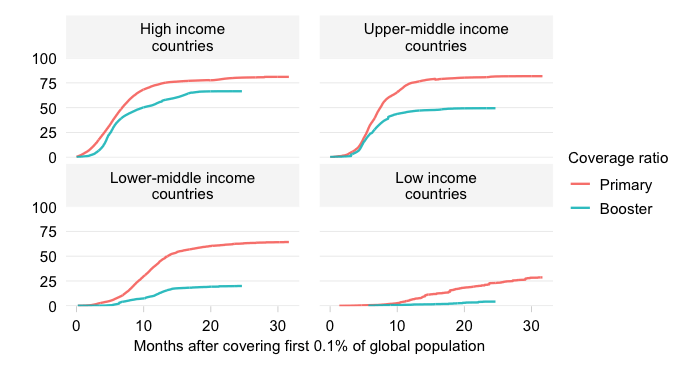
Global vaccination has been highly regressive. The dynamic visualization has shown this to be true at any point in time over the entire course of the pandemic. Initially the primary vaccination campaign was slow to take off in the poorer countries. Momentum in these countries did pick up somewhat later on, but by then the richer ones started rolling out their booster programs. Throughout, total vaccination levels in the poorer countries have remained abysmally low. Even today we continue to see enormous gaps – a topic which is further discussed here.
While the speed of vaccine development and diffusion during the COVID-19 pandemic has been without precedent, the situation in the poorest countries – the focus of this post – remains the exception, which is also what makes their predicament an ignominy. Much of the world booked rapid progress, while precisely the poorest of poor countries were left behind.
This serves as a reminder that the inequities that surfaced during the global vaccination campaign are rooted in deeper inequities in global health and development, which in turn reflect persistent bottlenecks to the aspirations of countries. Unfortunately, yet again, they have shown their ugly face in the vaccine inequity we have observed. An ignominy of our times.
Disclaimer: Posts by the Center for Global Development reflect the views of the authors, drawing on prior research and experience in their areas of expertise. CGD is a nonpartisan, independent organization and does not take institutional positions. Likewise, views expressed do not necessarily reflect those of the United Nations, the United Nations Development Programme, its programmes/projects or governments. The designations employed do not imply the expression of any opinion whatsoever concerning the legal status of any country, territory or area, or its frontiers or boundaries.