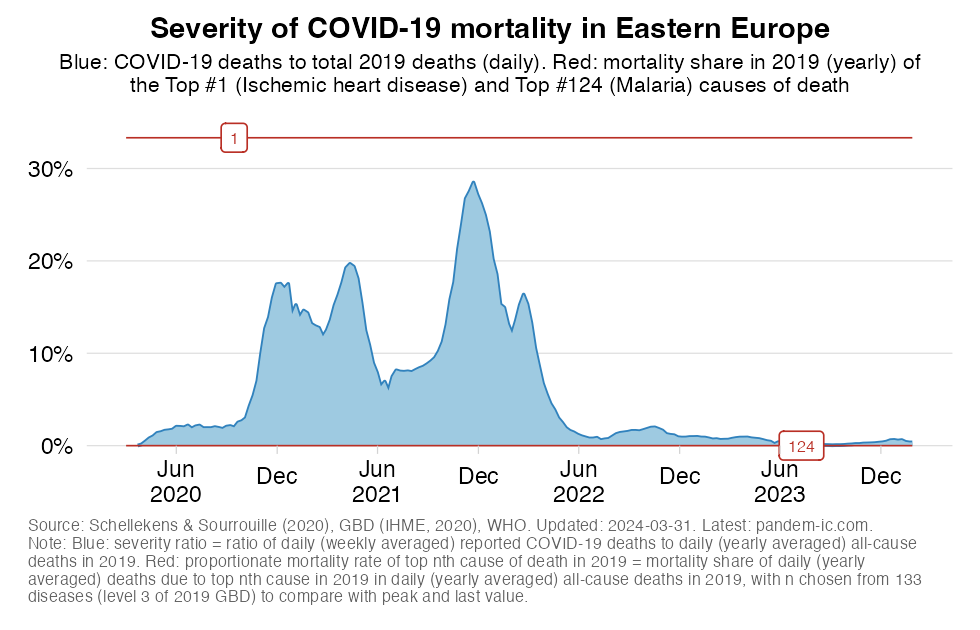
This chart shows the evolution over time of the ‘excess severity ratio’ at the UN subregional level and makes a comparison of excess mortality in the context of the pandemic with the top causes of death in 2019 within this subregion.
The excess severity ratio relates excess mortality accrued over the course of the COVID-19 pandemic to the level and profile of pre-pandemic mortality. The ratio itself is defined simply as the ratio between (1) the total number of estimated daily excess deaths (averaged over the course of a week) and (2) the total number of reported daily all-cause deaths in 2019 (averaged over the course of a year). Note that all-cause mortality from 2019 is averaged yearly in the interest of having a globally comprehensive sample.
The excess death estimates are derived from the excess death model by The Economist. We use the mid-point estimates that their model generates. Note that there may be a wide band of uncertainty around these estimates.
The excess severity ratio is then used to make two types of comparisons.
Note that the expression of mortality in relative terms is a useful way to communicate the severity of the pandemic. Countries will have adapted to their specific patterns of mortality. Deviations from this pattern may create pressure points, such as on the health system. Comparisons with previous patterns give a country-specific and intuitive flavor of the severity of the COVID-19 pandemic. A statement such as “the excess mortality toll currently amounts to more lives lost than the loss of life due to the top cause of death n 2019” may convey a better feel for the severity of the pandemic than a reference to a crude mortality rate (total deaths per 100k people).
Note that comparisons with top causes of death are with reference to the 133 disease families of the 2019 Global Burden of Disease study (at the third level of ICD-10). We generally select the top nth cause of death, which most closely approximates the peak excess severity ratio from below. More details on the concept of severity are in the paper of Schellekens and Sourrouille (2020) that developed the concept, which can be found here.