The newly released estimates of excess mortality by WHO provide granular detail on the distribution of excess mortality by age, income and sex. The data not only confirm that men are more likely die of COVID than women, but also that the gap rises considerably among the elderly cohorts especially in the poorest half of the world. The world thus faces a triple inequality in excess mortality in the dimensions of age, income and sex.
Before we dive into the imbalance by sex, let’s first review the sex-aggregated data to focus on the inequalities in the data on excess mortality by age and income. ]These two inequalities have been covered in great detail in a companion post. Its main conclusion is that excess mortality rates among the elderly cohorts have been very high, particularly in the poorer countries of the developing world.
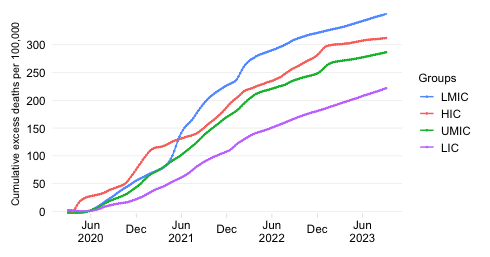
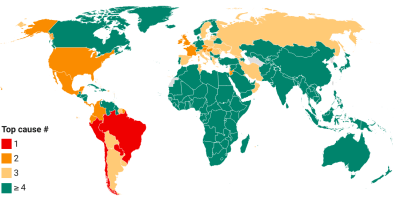
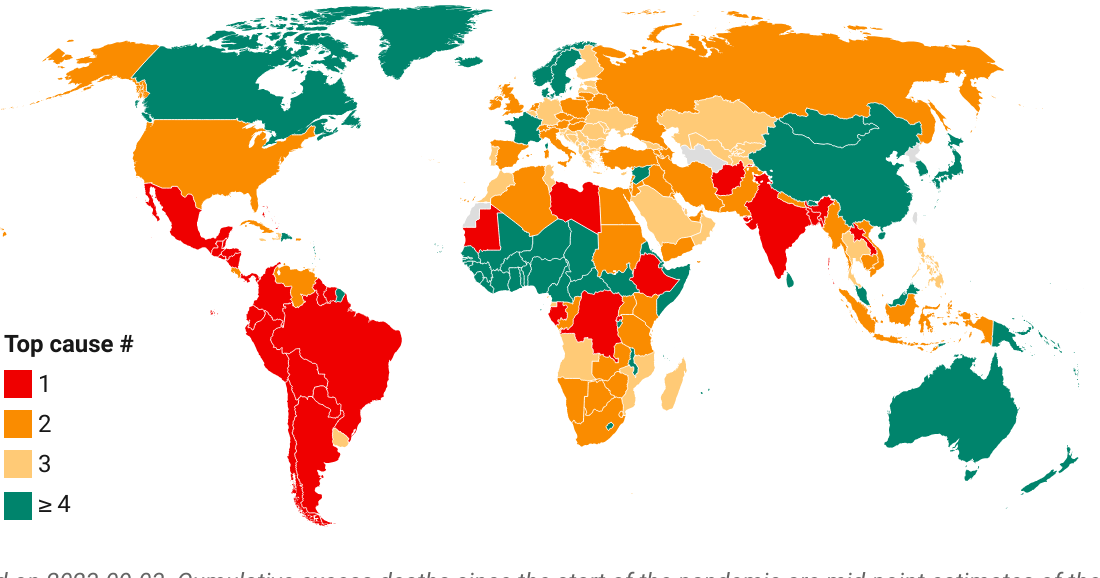
As elsewhere on this site, we use the World Bank income classification to distinguish between countries across the per capita income spectrum. The income classification thus splits the world into groups of high-income (HIC), upper-middle-income (UMIC), lower-middle-income (LMIC) and low-income (LIC) countries. The group of developing countries consists of the UMICs, LMICs and LICs. As it turns out, there are large differences between them with respect to the excess mortality by age.
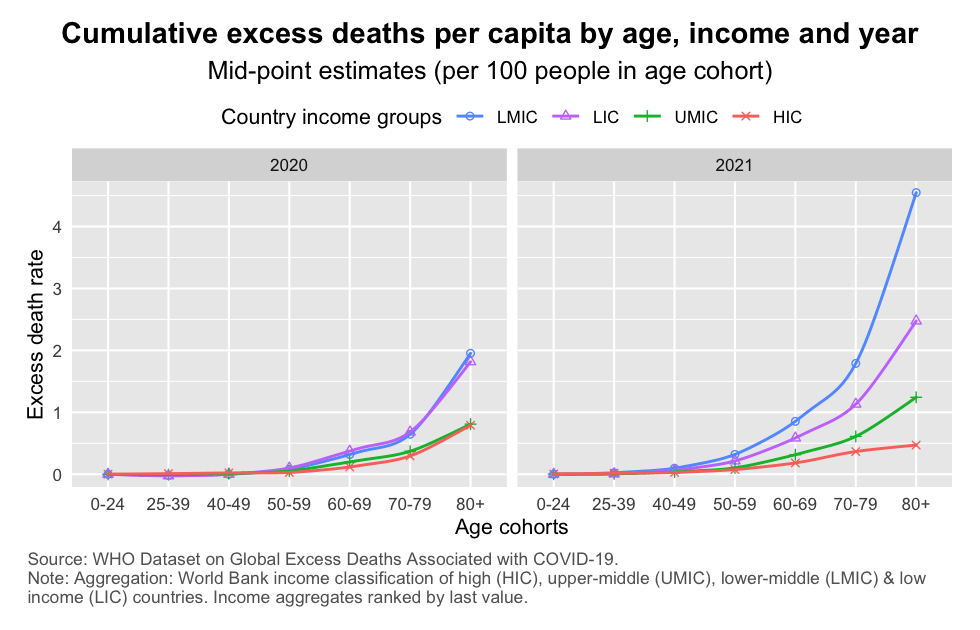
As the above chart illustrates, age-specific mortality rates rise exponentially as we progress along the age distribution. That is a standard feature of the COVID-19: it is an age-discriminating disease. But the curves of excess mortality by age also show distinct patterns by country income group.
Interestingly, in 2020 the mortality curves across income groups were clustered into two groups: the group of LMICs and LICs and the group of UMICs and HICs, with rates of the former being about twice those of the latter. But in 2021 these curves unclustered, with LMICs rising well above LICs and UMICs well above HICs.
The elderly cohorts in the poorest countries saw very high age-specific mortality rates. Just look at the LMICs in 2021, where an estimated 4% of the 80+ population may have died. Among the 70-79 and 60-69 cohorts, the mortality rate during that year was an alarming 2% and 1%, respectively.
Let us now add an additional layer of disaggregation to the results on excess mortality by age and income and examine how males and females have been affected differently. Throughout we maintain the disaggregation of excess mortality by age and income, so will be able to assess the three inequalities jointly.
Two further remarks: (1) we refer to sex and not gender, as we wish to refer to the biological and not the social characteristics of men and women in relating them to mortality; (2) all mortality rates here are obviously within-cohort mortality rates, so that eg the age-specific female rate in a particularly income group looks at excess deaths normalized by the population of that group.
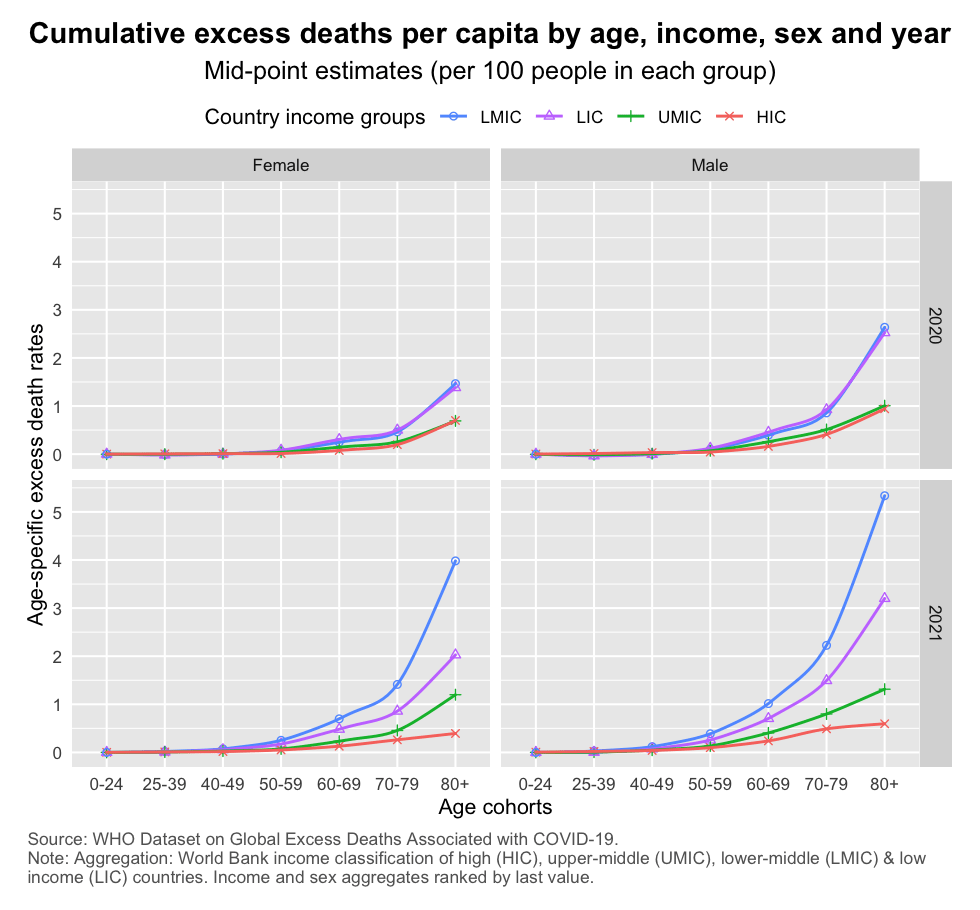
The chart above displays the triple inequality in a grid wrap of year (rows) by sex (columns), which facilitates comparison. Note that the male and female mortality curves follow a similar pattern: they rise steeply in the age dimension and they are similarly spread out across the country income dimension. Throughout we note that the male mortality rates are considerably higher than female ones.
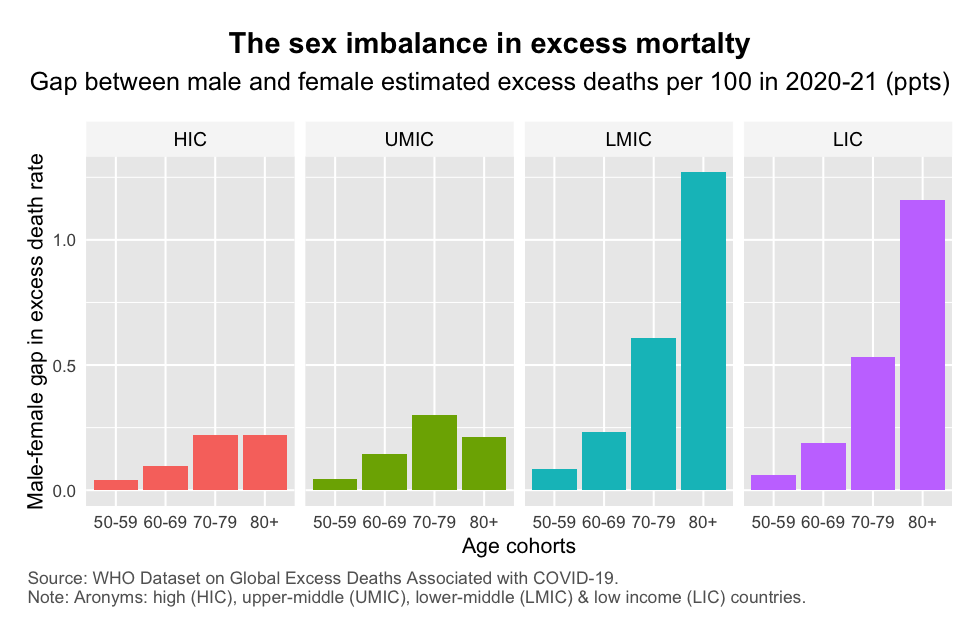
The absolute size of the male-female gap – expressed as the difference between the male and the female excess death rate per 100 people – is however much larger across all age cohorts in the poorer half of the world (the LMICs and LICs, which claim 52% of the global population).
The largest differences between LMICs/LICs and UMICs/HICs in the male-female mortality gap are situated in the oldest age cohorts. The discrepancy becomes very large especially in the 70-79 and 80+ groups. As such, whereas the male-female gap in mortality per 100 men 80 years and older is 0.25% in HICs and UMICs, it is 1.25% in LMICs and LICs.
Even before COVID, there was of course a “pre-existing mortality gap” between men and women. Studies for the US, for example, have pointed not only to biological differences but also social and behavioral factors that could help explain the sharp differences between male and female COVID mortality. Men are more likely to be employed in occupations with higher rates of exposure and fatality. Women are more likely to wash hands, wear masks and comply with social distancing restrictions. And they are more likely to be vaccinated.
These country-level explanations are also relevant when we try to explain the differences in excess mortality by age and sex across countries of different income levels. The above analysis suggests the gap rises steeply among the elderly cohorts and as we go down the income ladder from rich to poor countries. This thus generates a triple inequality – a sex imbalance most pronounced among the oldest age groups in the poorest countries.
The triple inequality uncovered in the WHO data underscores once more that this has been a pandemic of inequality. We have seen sheer inequalities in terms of outcomes (such as the inequalities in mortality outcomes discussed in this post). These have been compounded by inequalities in solutions (such as in the availability and administration of vaccines and therapeutics). The two have been positively correlated, turning observed inequalities into unaddressed inequities.
Efforts such as those by the WHO to provide data and estimates that disaggregate socio-economic dimensions are therefore a useful input into the analysis of inequity and an essential stepping stone to policy action. The old adage “what doesn’t get measured, doesn’t get managed!” clearly applies here.
Disclaimer: Posts by the Center for Global Development reflect the views of the authors, drawing on prior research and experience in their areas of expertise. CGD is a nonpartisan, independent organization and does not take institutional positions. Likewise, views expressed do not necessarily reflect those of the United Nations, the United Nations Development Programme, its programmes/projects or governments. The designations employed do not imply the expression of any opinion whatsoever concerning the legal status of any country, territory or area, or its frontiers or boundaries.