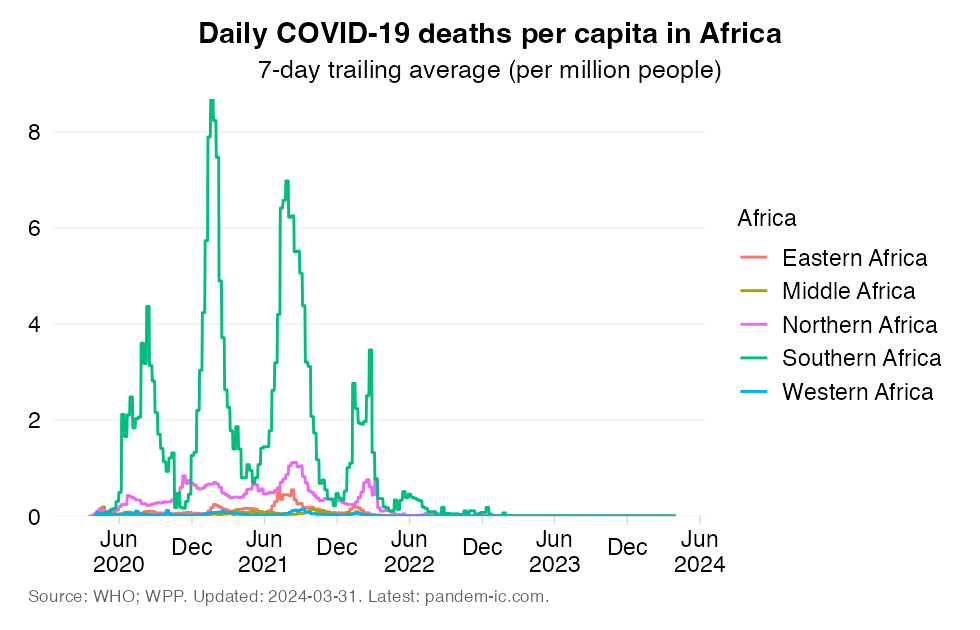
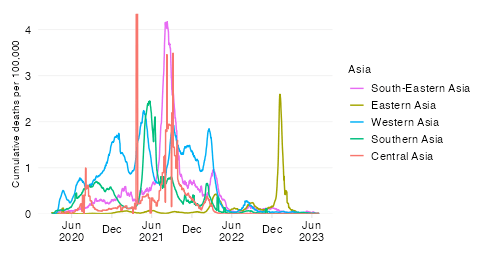
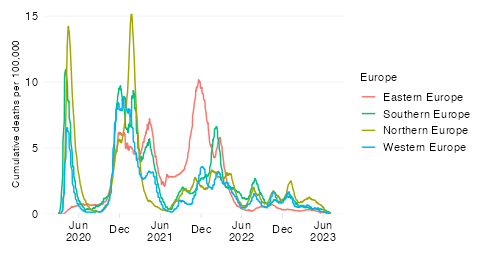
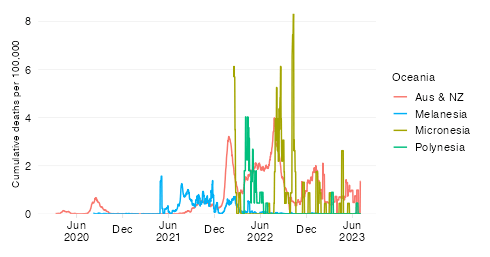
Daily confirmed COVID-19 deaths per million people 7-day trailing average
EXPLAINER
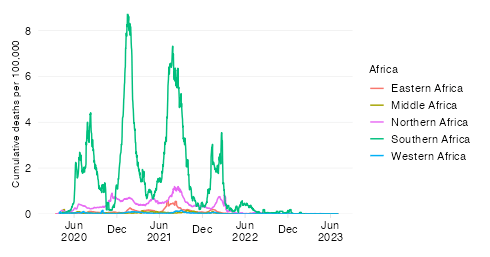
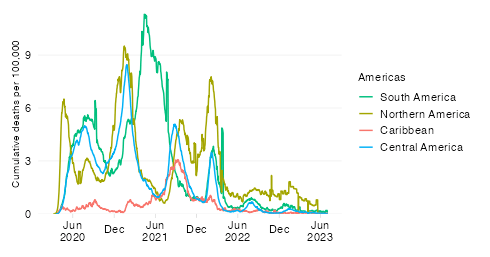
This chart shows the evolution over time of the daily COVID-19 mortality rate across UN subregions. To remove intra-week volatility in the reported data, the indicator is transformed into a 7-day trailing average (the average value of the latest observation and the preceding 6 days).
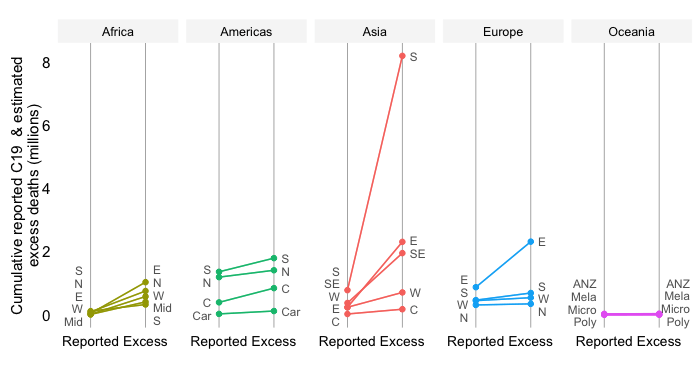
The mortality rate expresses COVID-19 fatalities relative to the size of the population. By relating COVID-19 mortality to population size, we get a measure of the burden of disease. In contrast to the absolute mortality toll, the mortality rate provides an indication of the performance of country or group of countries in terms of protecting its population against death with COVID as the underlying cause.
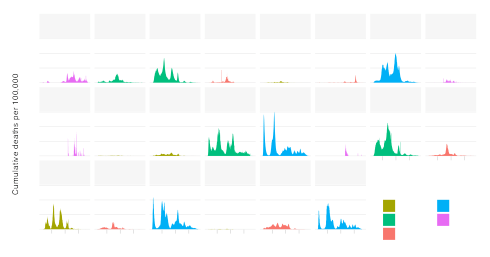
It should be noted that the different regional groups shown here are of very different population size dimensions. In light of these differences in population size, absolute mortality numbers will be quite different given the differences in rates.