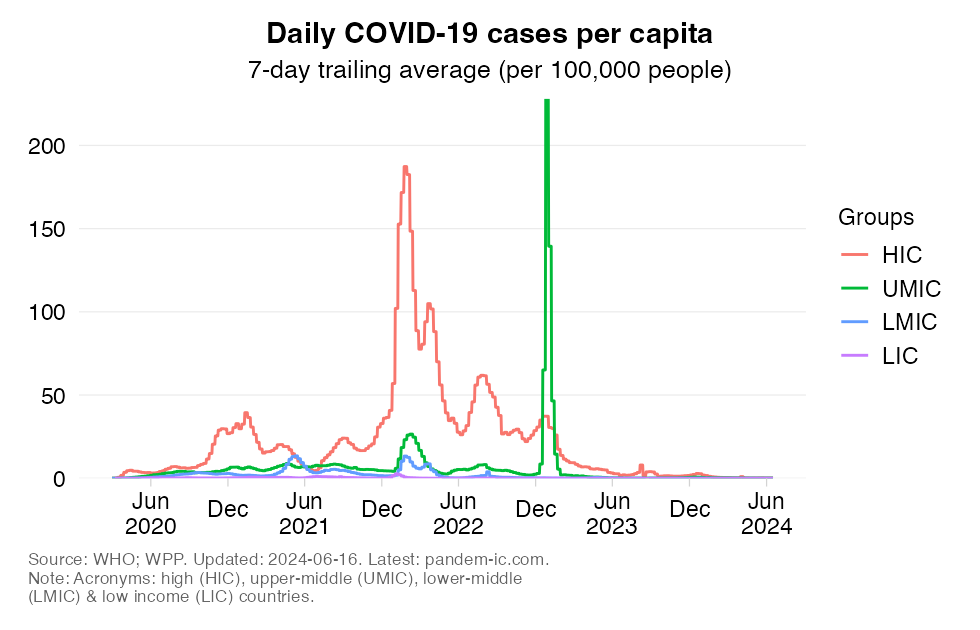
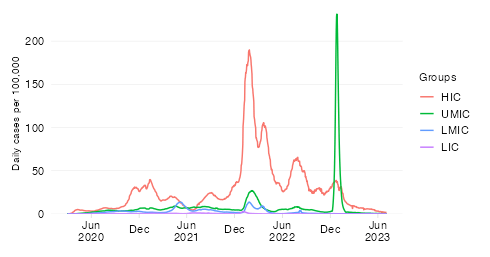
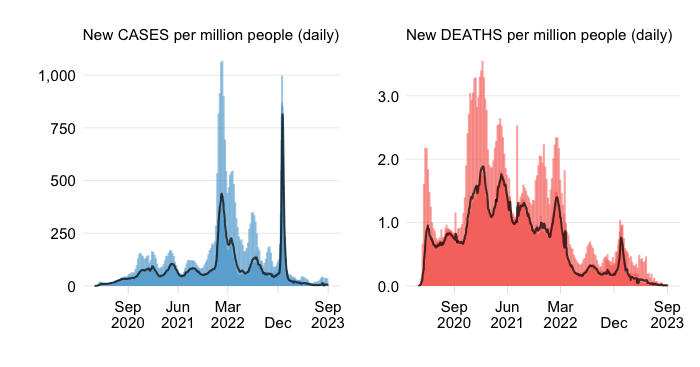
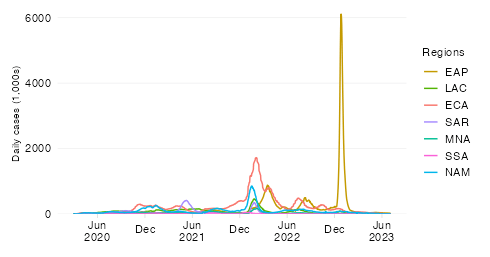
Daily confirmed COVID-19 cases per 100,000 people 7-day trailing average
EXPLAINER
This chart shows the evolution over time of daily COVID-19 cases per capita across World Bank income groups. To remove intra-week volatility in the reported data, the indicator is transformed into a 7-day trailing average (the average value of the latest observation and the preceding 6 days).
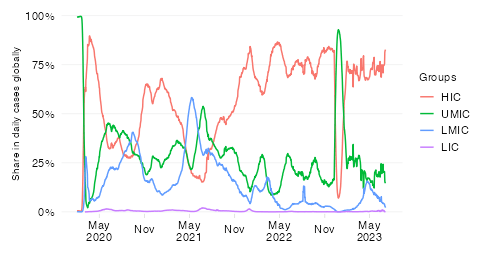
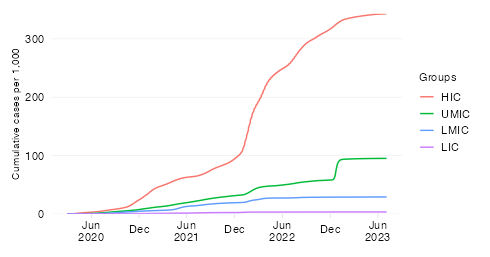
The case rate expresses COVID-19 cases relative to the size of the population.By relating COVID-19 cases to population size, we get a measure of the prevalence of confirmed infections within the community tested. In contrast to the absolute case toll, the case rate provides an indication of the performance of country or group of countries in terms of protecting its population against infection.
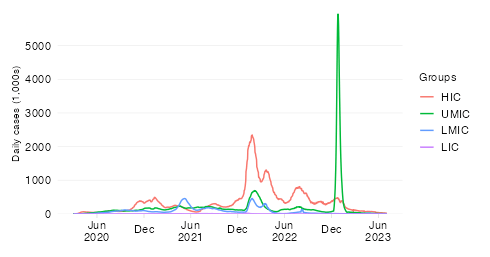
It should be noted that the different income groups shown here are of very different population size dimensions. The global population as per the 2021 medium-variant projection of World Population Prospects is 7,866 million people,which is distributed as follows:
High-income countries (HICs): 1,236 million
Upper-middle-income countries (UMICs): 2,567 million
Lower-middle-income countries (LMICs): 3,361 million
Low-income countries (LICs): 702 million
In light of these differences in population size, the absolute case toll will be quite different given the differences in rates.
Finally, it should be noted that limitations to testing will mean that the number of confirmed cases is lower than the true number of infections.