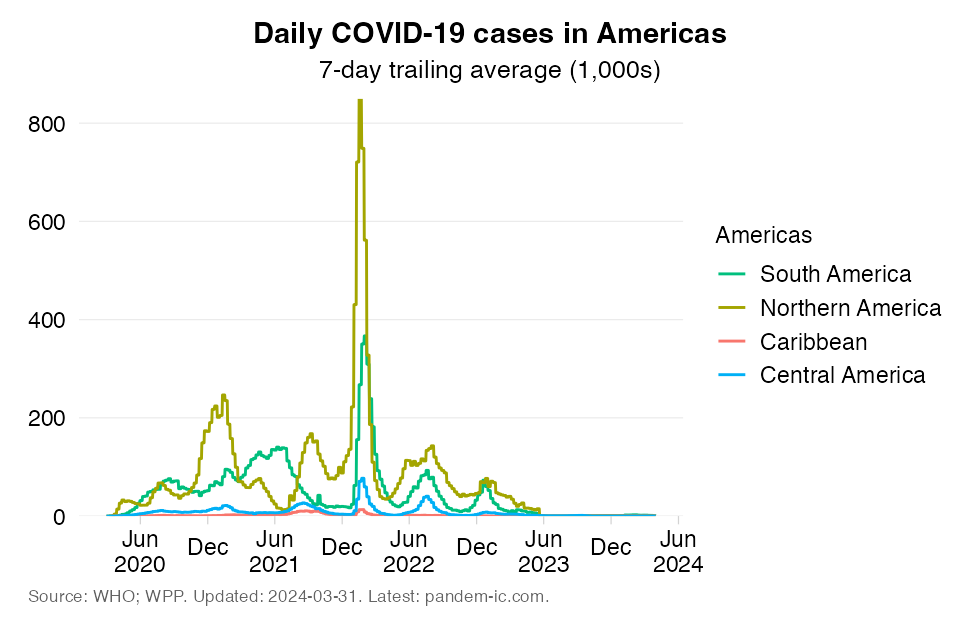
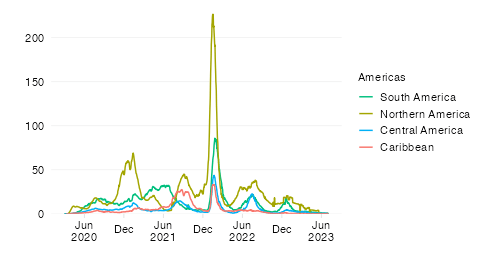
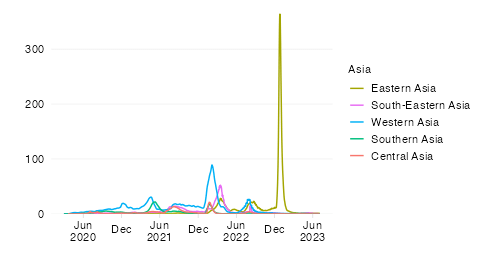
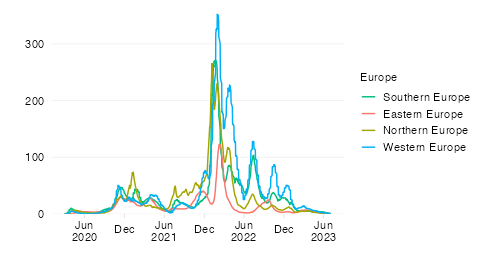
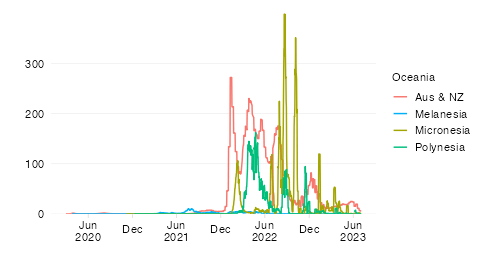
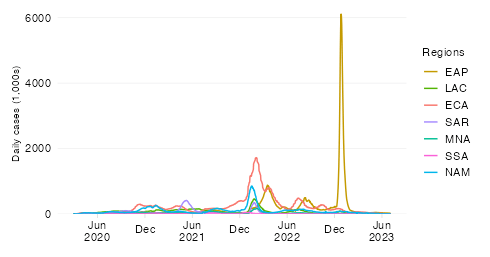
Daily confirmed COVID-19 cases 7-day trailing average
EXPLAINER
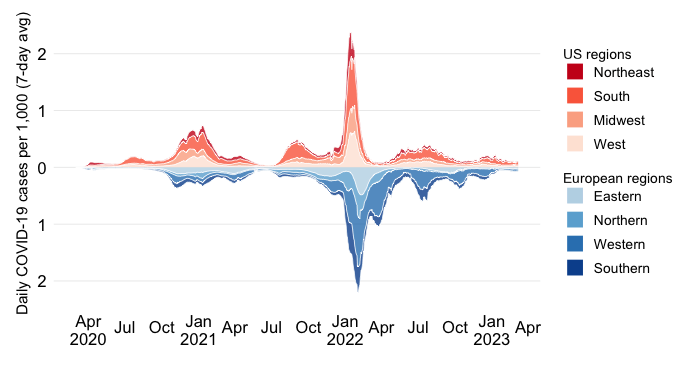
This chart shows the evolution over time of the daily COVID-19 cases in absolute numbers across UN subregions. To remove intra-week volatility in the reported data, the indicator is transformed into a 7-day trailing average (the average value of the latest observation and the preceding 6 days).
The absolute expression of cases is useful to highlight the the contribution of countries or groups of countries to the global total. In contrast, case rates, which express the absolute number of cases relative to population size, provide an indication of performance controlling for population size.
It should be noted that the different regional groups shown here are of very different population size dimensions. In light of these differences in population size, we expect large differences in absolute case numbers even if case rates were constant across groups.
Finally, note that limitations to testing will mean that the number of confirmed cases is lower than the true number of infections.