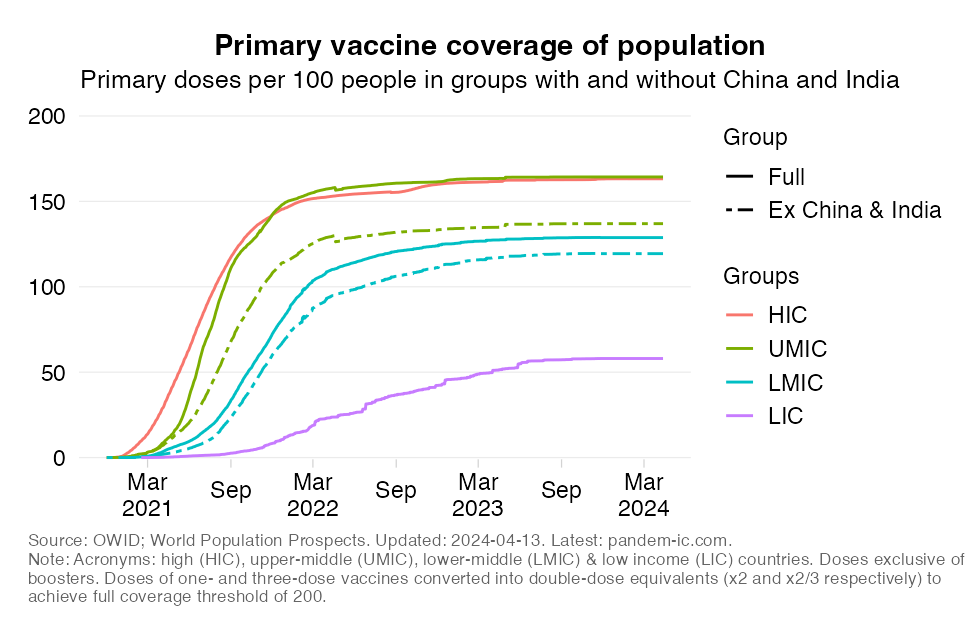
Primary vaccine coverage of population by income over time: the effect of China and India
Updated daily
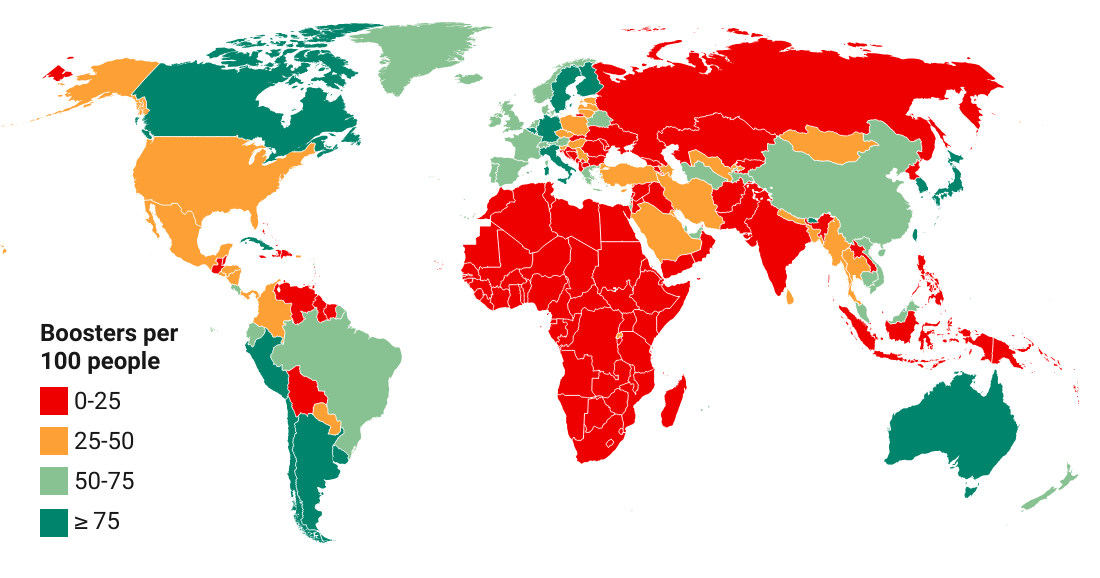
COVID-19 vaccine doses administered per 100 people
EXPLAINER
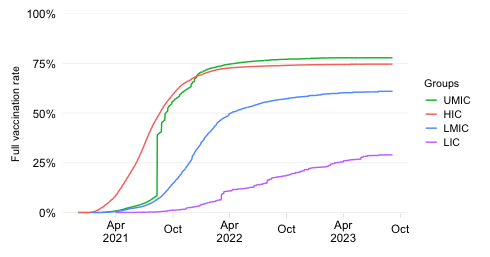
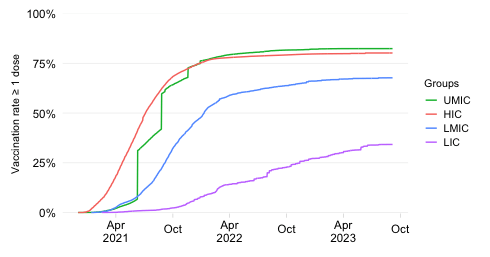
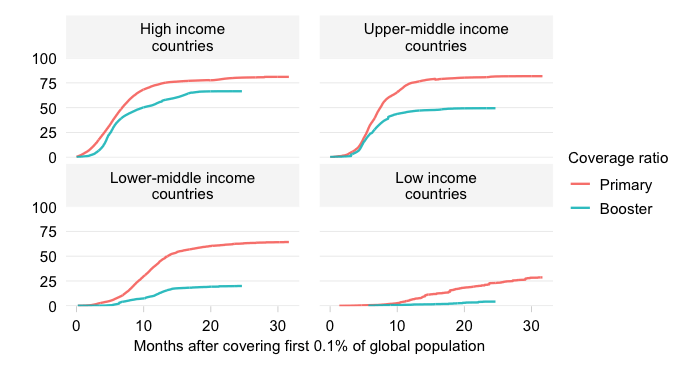
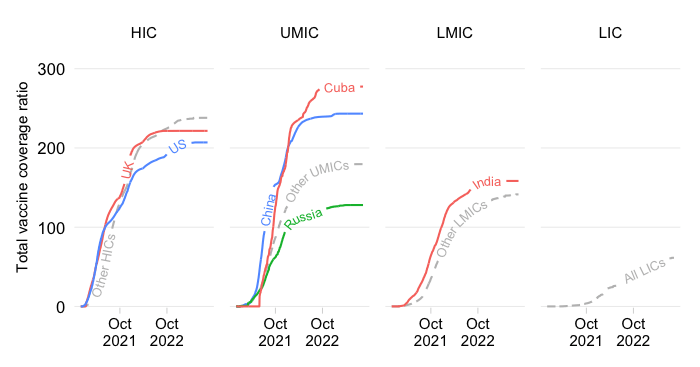
This chart shows over time the evolution in the primary vaccine coverage ratio across the World Bank income classification. It is calculated as the number of primary doses administered divided by the total population. Full coverage is achieved at 200 primary doses per 100 people.
Note that primary doses are the doses administered as per the primary (first) vaccination cycle, which excludes boosters. We distinguish from boosters to be able to compare vaccination progress across countries and country groups during the first round of vaccinations.
The chart also shows the evolution over time in the primary vaccine coverage ratio if we were to exclude China and India from their respective income groups (UMIC and LMIC, respectively). The values for HICs and LICs, as a result, remain unchanged.
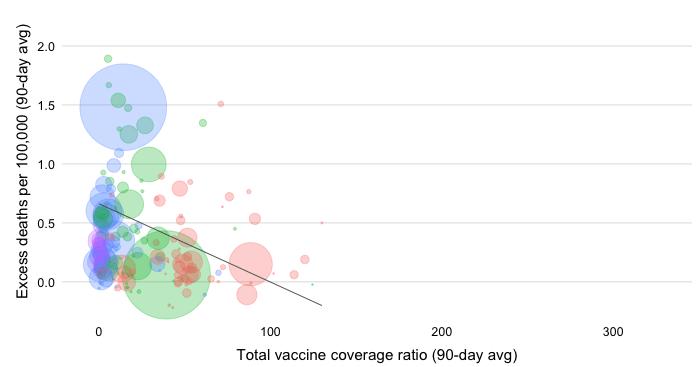
One further note on the calculation of the vaccine coverage ratio, which represents a new way of assessing global vaccination progress that yields consistent comparisons across countries invariant to the mix of vaccines used. The method employed is to convert all primary doses administered into double-dose equivalents. That means that doses belonging to 1-dose protocols are multiplied by 2 whereas doses belonging to 3-dose protocols are multiplied by 2/3. With this adjustment, we achieve 200 as the full coverage milestone for primary vaccinations.
For further details on the adjustment method, check outthis post and the background note below on double-dose equivalents and other aspects such as the World Bank income classification and the universe of countries.