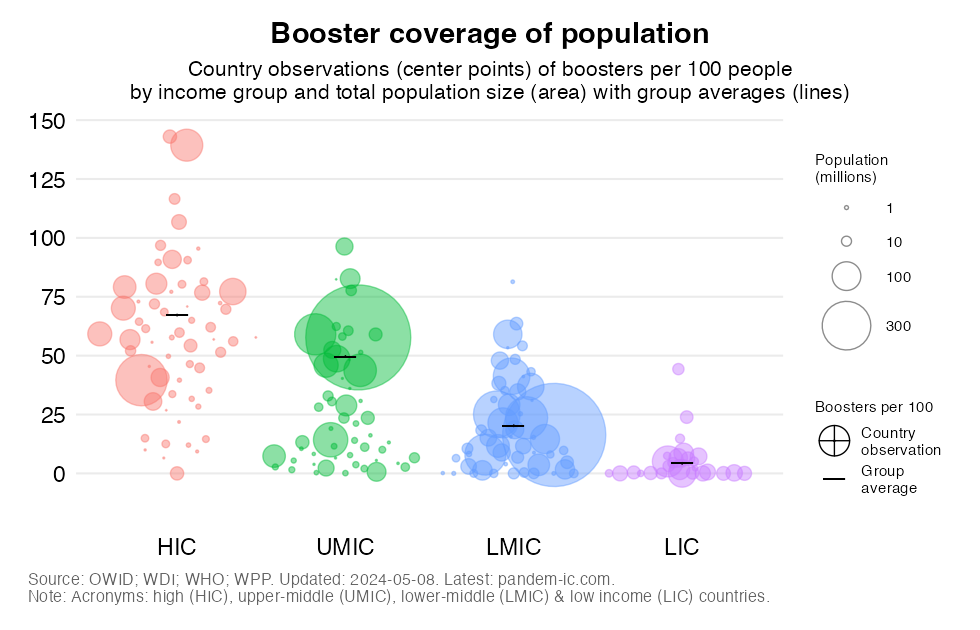
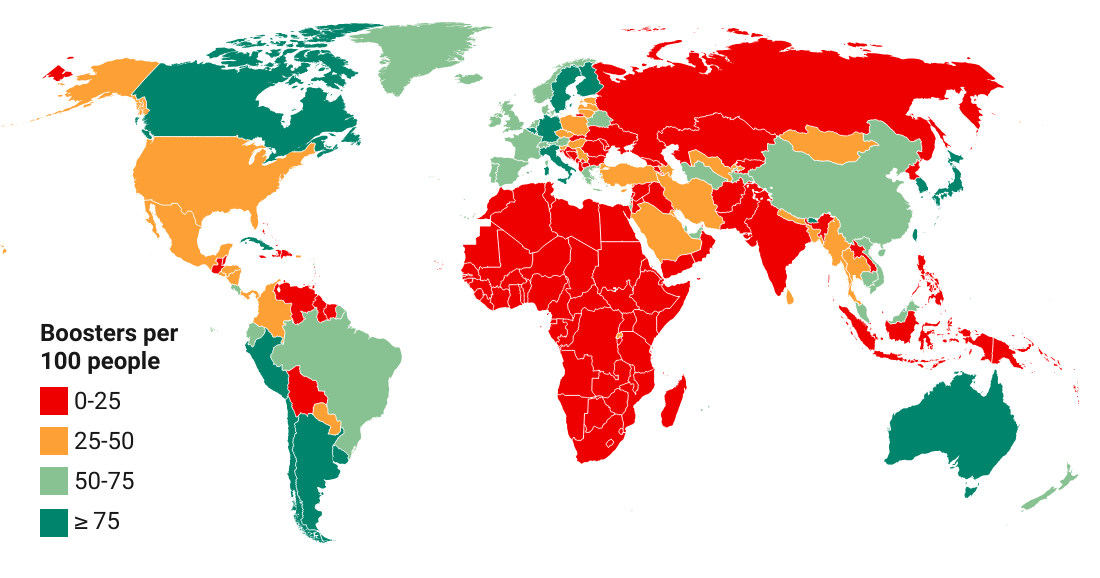
Booster coverage of population by country, income and population size
Updated daily
COVID-19 booster doses administered per 100 people
EXPLAINER
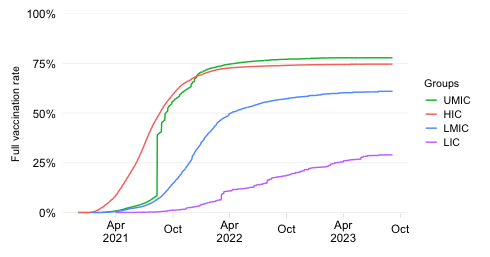
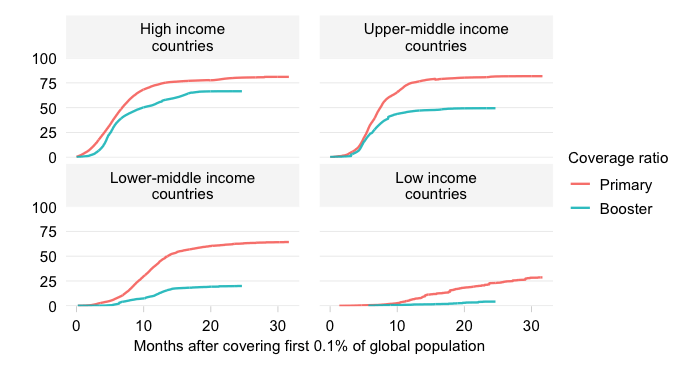
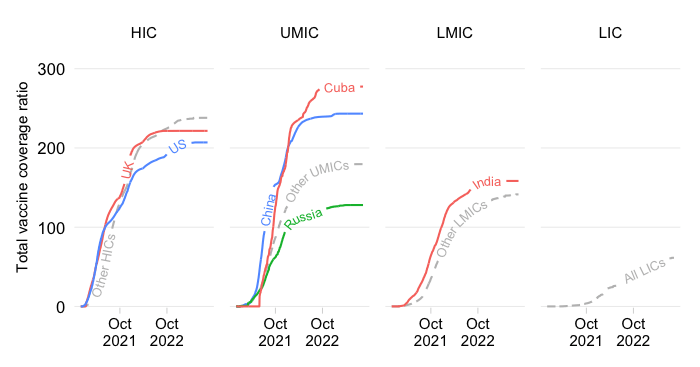
This chart shows the booster coverage ratio across the World Bank income classification. It is calculated as the number of booster doses administered divided by the total population. Full coverage is achieved at 100 booster doses per 100 people.
Note that booster doses are currently captured as the first cycle of booster doses beyond the primary vaccination cycle.
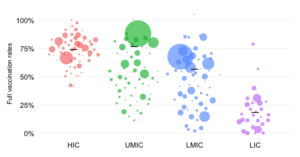
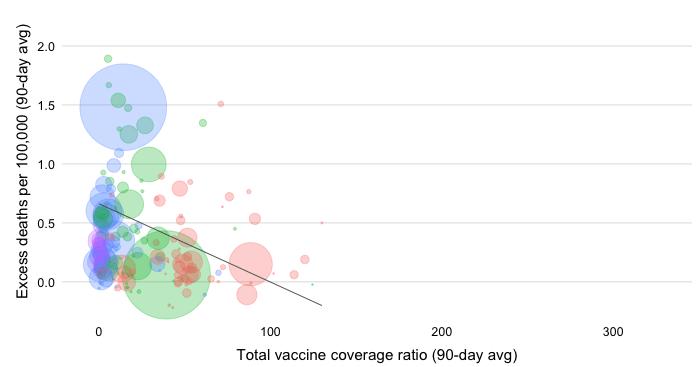
The midpoints of the bubbles represent country observations of the booster coverage ratio. Also shown are the weighted group averages for the booster coverage ratio of each group, which are represented by a horizontal line.
The size of the bubbles in the chart reflects the total population size. The large green bubble among UMICs is China. The large blue bubble among LMICs is India. Note that the global population as per the 2021 medium-variant scenario of World Population Prospects is estimated at 7.9 billion and is distributed as follows across the World Bank income classification: