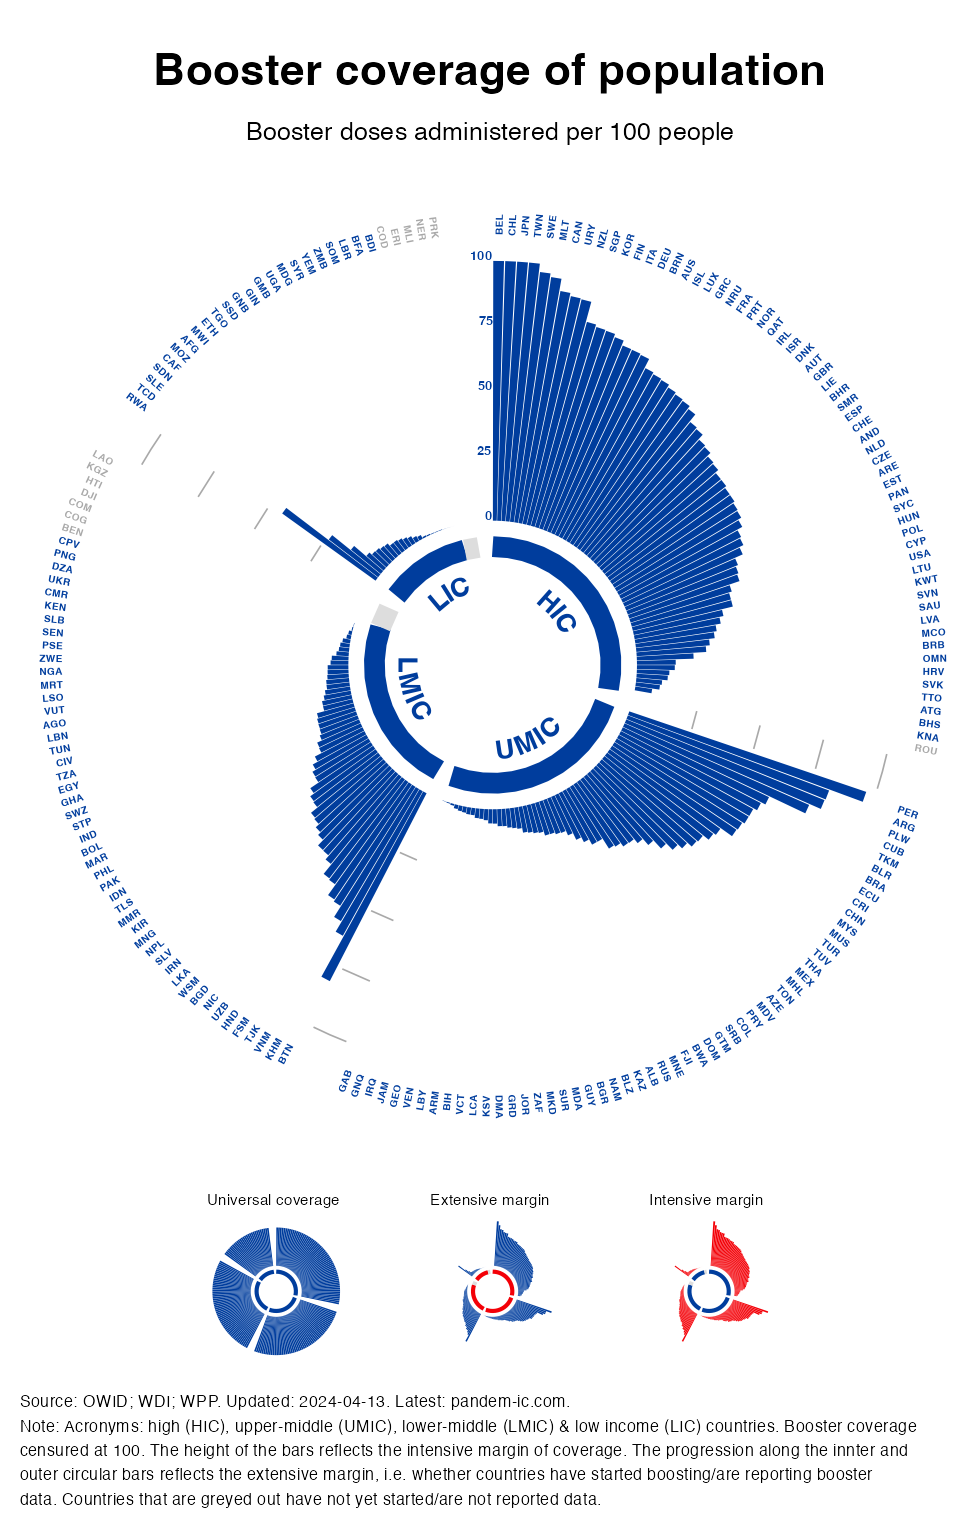
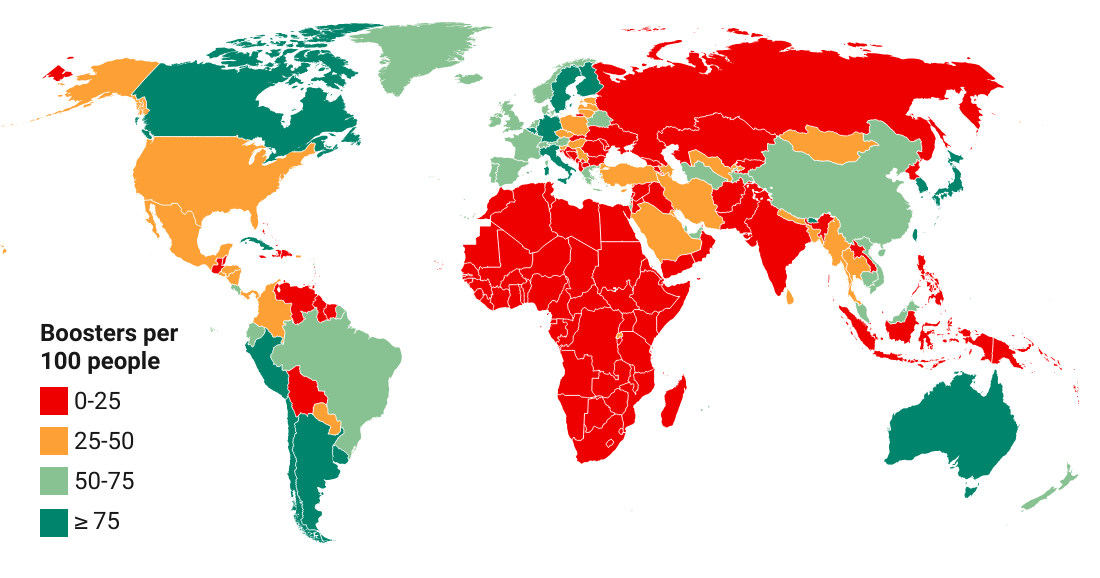
Booster coverage of population by country and income
Updated daily
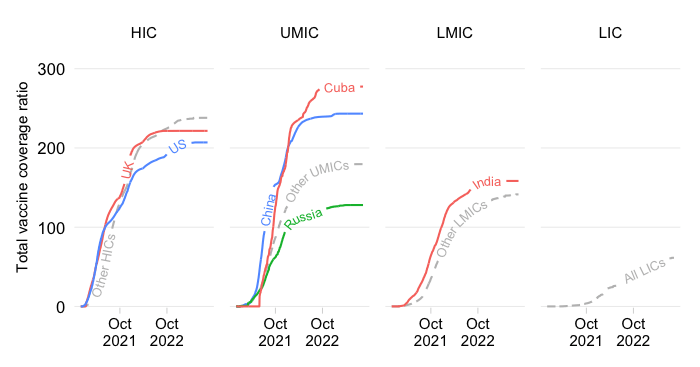
COVID-19 booster doses administered per 100 people
EXPLAINER
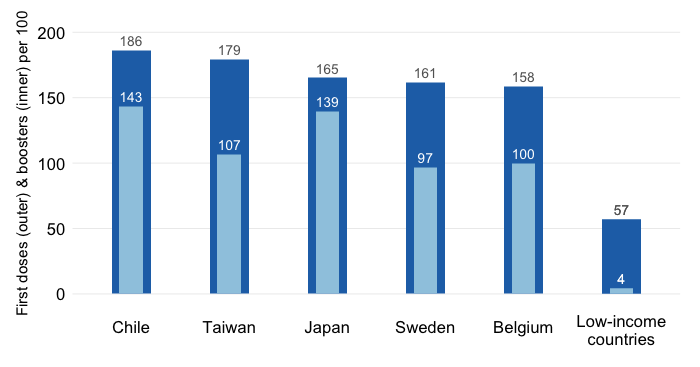
This chart shows the booster coverage ratio across countries by World Bank income classification. The coverage ratio expresses the number of booster doses administered as a ratio to the total population (per 100 people). Booster vaccinations include all shots that are not considered part of the primary vaccination cycle.
The chart shows the extensive margin of vaccination (whether countries have started boosting as represented by the circular inner and outer bars turning from gray to blue in case data on booster doses administered is reported) and the intensive margin (the actual level of the coverage ratio, which is represented by the vertical bars for each country). Note that universal coverage on both the extensive and intensive margins would amount to this donut turning entirely blue.
The equivalent of this chart for primary vaccinations is available here.